Why is Ethereum being outperformed by Bitcoin? Historical pattern changing in 2023


Key Takeaways

  • Ethereum has historically outperformed Bitcoin in bull runs
  • The pattern has flipped to start the year, with Bitcoin dominance rising 
  • Our Analyst Dan Ashmore jumps on-chain to look through history, and show how and why the pattern is changing

The Flippening, huh? Nothing incites debate within crypto circles quite like it. 

Referring to a scenario where Ethereum flips Bitcoin for the number one spot in the cryptocurrency ranks, the Flippening is anything from inevitable to delusional, depending on who you ask. 

I’m not sure I want to walk across the eggshells of that debate, for fear of my Twitter DMs, but I noticed something pretty interesting today when digging into the data on Ethereum vs Bitcoin. 

Ethereum is strongly correlated with Bitcoin

Firstly, the obvious. Ethereum is incredibly correlated with Bitcoin because, well, it is a cryptocurrency, and every crypto’s fate is tied to that of the orange coin. We know this by now. 

The graph below shows how tight this relationship has been since Ethereum went live back in 2015. 

But while these two best buddies follow each other around across the price charts, there are scenarios where they diverge a little bit. The famous ETH/BTC ratio is one which Ether fans in particular keep a keen eye on. 

It peaked in June 2017 at close to 0.15 before freefalling down to 0.025 before the end of the year. Today, it trades at around 0.07. 

Ether is better at bull markets than Bitcoin

You may have noticed that the previous ETH/BTC chart resembled the shape of the crypto market overall, through its many ups and downs. 

I plotted the price of Bitcoin against this ETH/BTC ratio. Indeed, the ratio rises as Bitcoin rises, and falls and Bitcoin falls. Using the Bitcoin price as a proxy for the whole industry, this suggests that the ETH/BTC ratio rises in bull markets and falls in bear markets. 

This makes sense. Bitcoin is often referred to as the boomer coin. I quite like it that way, despite it being meant as an insult, by the way. But it’s an understandable moniker because Bitcoin does move like a pensioner during bull markets when compared to altcoins. 

Ether may be the largest of the altcoins, but it still outperforms Bitcoin when the bulls are out to play. 

On the flip side, Bitcoin outperforms when the party ends. And by outperform, I mean that it tends to drop 60% as opposed to 70%. But hey, that’s for another day.

Pattern has flipped in 2023

But the price charts are showing something different. One month into the new year, Bitcoin has surged while the ETH/BTC ratio has fallen – precisely the opposite of what has happened historically. 

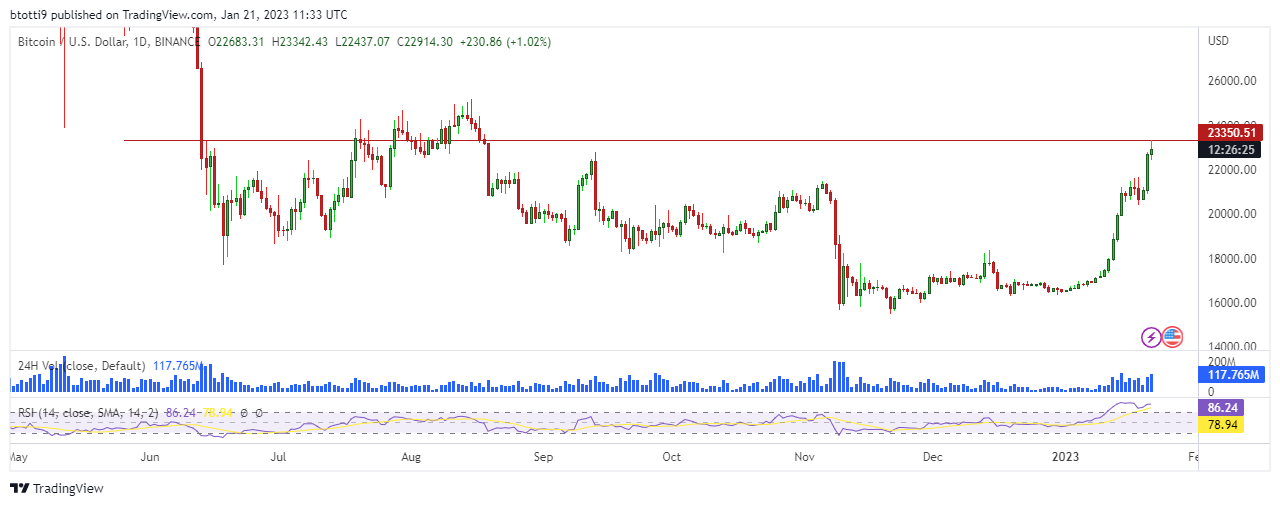
I charted the ratio back to the start of November, when Sam Bankman-Fried’s fun and games were revealed to the world and crypto fell, with Bitcoin cratering down to $16,000. 

The chart shows that the pattern remained as you would expect, i.e. the ratio fell as crypto and Bitcoin pulled back. But as we turned the page into 2023, the crypto market flipped and Bitcoin soared. Only problem is, ETH didn’t follow, but rather the ratio has fallen, from 0.077 on January 11th to 0.068 currently, despite Bitcoin spiking from $17,400 to close to $23,000 over the same period. 

Why? Honestly, I’m not sure. It’s unusual. 

Bitcoin is up 36% on the year whereas Ether is only up 29%. Yet looking at the returns of other altcoins, perhaps it is nothing to do with Ether. Many are being outperformed by Bitcoin, while even the outperformers are not doing so by as much as has been seen previously (note I have removed Solana for scale purposes, which is up 125% thus far this year, following being decimated by links to Sam Bankman-Fried and multiple projects fleeing the blockchain at the end of last year). 

In truth, this has just been a remarkable rise for Bitcoin from the depths of bear market pain. The rest of the market is not quite ready to forget the armageddon that was 2022, with many altcoins paring down over 90%. 

Ethereum wasn’t quite as bad, but still fell from an all-time high of nearly $5,000. The free money and stimulus packages of the pandemic are over. It is a different climate now, and it is proving more challenging to kick up hype for altcoins. 

The web3 narrative has faltered. NFTs have been crushed. There is no doubt that the narrative around ETH has been torn down. I have written about how institutional adoption will pare back in crypto, and how the sector’s reputation will take a long time to fix.

That is true for Bitcoin. Perhaps it rings even more true for ETH and altcoins, which have even more to do to regain investors’ trust. 

The post Why is Ethereum being outperformed by Bitcoin? Historical pattern changing in 2023 appeared first on CoinJournal.

Opportunity, or trap? Glassnode on Bitcoin price outlook

  • Bitcoin’s rally from December lows after the FTX collapse surprised many investors, Glassnode says in its weekly report.
  • Bitcoin could see further upside but a fresh buy signal is likely at prices around $28.3k.
  • Selling pressure above $23.3k is more likely given short-term holders and miner push for exit liquidity.

Bitcoin price remains poised near $23,000 after a breakout pushed the leading cryptocurrency’s value above the psychological $20k level.

As highlighted ove the weekend, Bitcoin’s surge to prices above $23,000 did surprise many people, and while optimism is high among bulls, a potential liquidity exit from profit booking is likely. Particularly, this could be the outlook given how brutal the 2022 bear market was for short term holders and miners.

On-chain data platform Glassnode has highlighted this possibility.

Glassnode’s outlook after latest BTC price action

According to on-chain data firm Glassnode, Bitcoin looks “almost out of the woods,” but the price action to levels in the $21k to $23k region also reclaimed several on-chain pricing models.

A look at the Investor Price (currently at $17.4k) and Delta Price ($11.4k), signifies a similar price action at the bear market bottom of 2018-2019. Investor Price is the average price at which investors acquired all the spent and miner distributed coins, while Delta Price is derived from Realized Cap minus Bitcoin’s all-time Average Cap to get a technical pricing model.

At the base of this outlook is the price discovery phase, which during that 2018 bear market bottom lasted 78 days. The current market is at a similar level, with BTC above the Realized Price of $19.7k.

This suggests an equivalency in durational pain across the darkest phase of both bear markets,” Glassnode wrote in its weekly market report.

Still on the Investor Price/Delta Price metrics, the on-chain platform points to a measure called compression, which takes into account the spot price to determine the intensity of the market’s undervaluation.  The metric also correlates with the scale of change in an asset’s Realized Cap or capital inflow volume, with a threshold zone of 0.15-0.2.

Given the current BTC price and compression value, Glassnode estimates a bullish confirmation signal could be triggered if Bitcoin bulls reclaim $28.3k.

More optimism for bulls

Also helping the bull case is the Supply in Profit measure, which spiked 12% in the last two weeks to rise from 55% to 67%. The spike in percent of coins in profit is “the sharpest” of all prior bear markets, suggesting a lot more coins changed hands below the $23.3k level.

Key to bulls’ case is also the fact that Bitcoin price at current levels is above all the three cost basis of long-term holder, short-term holder and BTC Realized Price. This is the first time spot price has pierced the three Realized Prices and sustained momentum above the levels would be positive.

A bull trap case

While Glassnode points to potential bull case scenarios, its report also highlights probable cases of fresh sell-off pressure.

According to the on-chain data report, one of these is the “substantial spike in profitability,” which the platform says raises the possibility of selling pressure triggered by short-term holders. 

Miners are also likely to be motivated by the price action and might look to liquidate some of their holdings, adding to a potential retreat for BTC price.

The post Opportunity, or trap? Glassnode on Bitcoin price outlook appeared first on CoinJournal.

Bankrupt BlockFi plans to sell $160M Bitcoin mining hardware loans

  • BlockFi filed for Chapter 11 bankruptcy in November 2022 citing exposure to the just collapsed FTX.
  • The plan to sell off the loans backed by Bitcoin mining machines is part of the bankruptcy proceedings.
  • Bidders have until before the end of January to submit offers.

About two months after BlockFi filed for Chapter 11 bankruptcy, the crypto lender now plans to sell off $160 million in loans backed by Bitcoin mining hardware as part of the bankruptcy legal proceedings. In total, the loans are backed by about 68,000 Bitcoin mining machines

Although BlockFi cited FTX’s exposure as the main reason for its bankruptcy, the crypto lender had announced cutting its workforce by 20% in June 2022 citing the crypto prices meltdown. The layoff announcement came days after reports emerged that the lender was in talks to raise funding at a $5 billion valuation.

Bidders have until January 24 to send offers

According to reports from Bloomberg, BlockFi started the process of selling off the Bitcoin mining hardware-backed loans last year. It is believed some of the said loans have already defaulted since then and are candidates for under-collateralization following the drastic decline in the prices of Bitcoin mining hardware.

In an interview with one popular media outlet, crypto lawyer Harrison Dell who is a director at Australian law firm Cadena Legal said that the loans are not worth their paper value to BlockFi if the Bitcoin mining equipment used as collateral is worth less than the value of the loans.

According to Harrison Dell, the people bidding for the loans are most likely debt collection businesses saying that selling the debts is all that BlockFi can do at the moment.

It is believed that BlockFi’s attempt to sell off its loans is likely a part of the lender’s efforts to pay off its creditors who are about 100,000 in total.

The post Bankrupt BlockFi plans to sell $160M Bitcoin mining hardware loans appeared first on CoinJournal.

Bitcoin’s “hedge” narrative is dead, as speculative price action continues


Key Takeaways

  • Crypto has risen to start the year off the back of expectations that interest rates may be cut sooner than anticipated
  • This contrasts with the view that crypto is uncorrelated, proving it false
  • Assessing the price action of crypto through the pandemic and subsequent rate-raising cycle shows an extremely risky asset class that moves in line with other speculative asset classes

Over the last couple of months, markets have turned green off the back of inflation data softening around the globe. Crypto hasn’t been left off the invite list, with digital assets surging to their strongest rally in 9 months.

If there was ever any doubt (and by now, there really shouldn’t be), this proves once and for all that any narrative around crypto being an uncorrelated asset is dead.

Pandemic bull run

To quickly recap on the last few years in cryptoland, the asset class initially moved violently upward as central banks worldwide pursued ultra-low interest rate policy.

As economies ground to a halt for the ultimate black swan, the COVID-19 pandemic, nations faced a highly uncertain outlook in Q1 of 2020. With lockdowns sweeping the world, central banks were forced to do what they could to stimulate these abruptly-shut societies. 

Out came stimulus packages of an unprecedented scale. 

With all this stimulus and generationally cheap money, risk assets went bananas. The biggest leader of all was cryptocurrency. Some argued that the assets were rising as a result of the inevitable inflation that would result from all this expansionary monetary policy, as crypto was a hedge against the fiat system. The argument wouldn’t hold.

The transition to a new interest rate paradigm

The year 2022 did indeed bring a spike in inflation, and this time central banks were forced to do the opposite – aggressively hike rates as the cost of living spiralled relentlessly.

This has reined in risk assets, as per the playbook. Liquidity is sucked out of the system, suppressing demand. Investors now have alternate vehicles in which to park their wealth and earn a yield, with government-guaranteed T-bills now offering reasonable alternatives, as opposed to the zero rates previously (or negative in some nations).

But cryptocurrency followed the rest of the world’s risk assets down. Not only that, but the scale of the meltdown in the sector was unlike anything we have seen in a major asset class in a long time. Bitcoin shaved over three-quarters of its market cap, and it came out favourably compared to altcoins, many of which were decimated.

And now, the last couple of months have brought more optimistic readings regarding inflation. The numbers are still scary, but just a little bit of positivity has crept in that the worst may have passed. Of course, there is still a war ongoing in Europe and now fear has elevated that a recession may be imminent (if not here already), but hey – let’s celebrate whatever wins we can.  

The stock market has cautiously crept upwards, as the market moves to the expectation that high interest rates will cease sooner than previously expected.

The only thing is, crypto has also risen. Not only that, but it has printed gains which blow the moves in equity markets out of the water.

Which, you know, kind of suggests that this may not be an inflation hedge at all. As inflation comes back down and the likelihood of lower rates and another expansionary period grows, crypto rises. Go figure.

Correlation vs stock market remains high

The proof is in the pudding. It is pretty clear by simply looking at the price chart of S&P 500 vs Bitcoin that the correlation here is stark – with the key lurking variable being interest rates. 

Quite literally, crypto is the opposite of an uncorrelated asset – it has moved in lockstep with the stock market for the last few years. 

Interestingly, there have been periods of decoupling, however. Unfortunately, they have come amid crypto-specific crashes. To show this, I plotted the Bitcoin/S&P 500 correlation against the Bitcoin price over the last couple of years. 

The correlation has been high, aside from a few noticeable periods – all occurring when the Bitcoin price plummeted. The most recent example was November 2022, when crypto wobbled amid the FTX crash

There really is no debate here. Crypto is a highly correlated, extreme-risk asset. The only question is whether it can shed this moniker in the long term. But any thought contesting that it is not currently wildly speculative is wide of the mark.

The post Bitcoin’s “hedge” narrative is dead, as speculative price action continues appeared first on CoinJournal.

Bitcoin hits 5-month high as bulls push BTC above $23K

  • Bitcoin hit highs of $23,342 on Binance, with a breakout above $22k extending year-to-date gains.
  • BTC price is up 30% in a month and has recovered 47% since the decline to $15,500 lows.
  • Short liquidations were around $376 million in the past 24 hours.

Bitcoin price roared to highs above $23,000 on Saturday morning, rising to $23,342 on Binance as the price of the world’s largest cryptocurrency by market cap hit levels last seen in mid-August 2022.

BTC was changing hands around $22,900 at the time of writing, about 9% up in the past 24 hours after shedding some of the gains. 

The price of Bitcoin was, however, still 35% up in the past 30 days, and as crypto trader and analyst Rekt Capital pointed out earlier this morning, BTC had rallied over 47% since falling to lows of $15,500 amid the FTX dump.

Bitcoin price chart showing BTC rally to $23,000 on 21 January, 2023. Source: TradingView

 On-chain data platform Santiment noted just before today’s break above $23k that Bitcoin’s price rally has come amid a bullish outlook from large BTC investors. As the firm highlights in the chart below, whale addresses with 1,000 to 10,000 BTC have in the past two weeks accumulated over 64,638 bitcoins worth more than $1.46 billion.

Over $376 million in shorts liquidated

As Bitcoin raced to highs near $23,350, liquidation data showed that in the past 24 hours, about 80,497 traders had been liquidated.

According to Coinglass, the largest short liquidation was on Bitmex where an order worth $4.53million was rekt. The total liquidations as of 06:10 am ET on 21 January were $376.61 million. 

Notably, total liquidations are not at the levels seen when BTC/USD broke above $20,000 last week towards erasing all post-FTX losses. Nonetheless, it still shows some traders are convinced this could be a gigantic bull trap. 

But as it is, further upside momentum could see bulls target $25,000 or possibly higher if sentiment across risk markets helps bouy buy pressure.

The post Bitcoin hits 5-month high as bulls push BTC above $23K appeared first on CoinJournal.