Bitcoin still trading like a risk asset, despite claims of decoupling amid banking crisis


Key Takeaways

  • First Republic has become the latest bank to collapse in the US
  • Bitcoin has bounced this week, as it did in March when SVB fell and the banking crisis was triggered
  • Our Head of Research, Dan Ashmore, contends that Bitcoin remains a risk asset, despite claims from enthusiasts that a decoupling is occuring
  • Correlation with stock market is still high, he writes, pointing to altered expectations around interest rate policy as the reason Bitcoin has moved upward

There has been chatter amid the market recently (again) that Bitcoin is decoupling from stocks. Something about Bitcoin offering an alternate store of value outside the realm of the fiat world, a proposition that has suddenly become a lot more valuable as the banking turmoil striking the US rages. 

Let me start by saying that I don’t think my opinion is very valid here. I can’t predict the future. But I want to look at the numbers because I believe they prove that this theory, that Bitcoin has decoupled, is objectively false. 

I wrote a deep dive on Bitcoin’s correlation with stocks in March, when this theory originally surfaced as Silicon Valley Bank collapsed, while Bitcoin raced upwards. The same logic applies now, so let me try summarise it by refreshing the same numbers. 

And a quick note – this article is nothing about my beliefs around Bitcoin’s trajectory in the long-term. Whether Bitcoin decouples in future and establishes itself as a store of value akin to gold, uncorrelated to other risk assets, is a debate for another time and not one I will delve into here. I’m purely looking at the price action today and saying that, as of May 2023, Bitcoin is trading like an extreme-risk asset, completely removed from this uncorrelated vision. 

Bitcoin’s correlation with the Nasdaq

The natural place to look is tech stocks, being one of the riskier subsectors of the equity universe. The Nasdaq, being a tech-heavy index, is often seen as the benchmark for this sector. So let us chart Bitcoin’s correlation with the Nasdaq over the past couple of years. 

Using a 60-Day Pearson measure, the chart shows that the correlation has bounced around a lot over the past couple of years. For the most part, however, it has shown a relatively strong relationship, frequently residing above 0.5. 

There were a couple of dips. The first is clearly May/June 2021, when Bitcoin cratered from $63,000 to $31,000 for no apparent reason, before climbing back up into the high sixties later that year. 

The second large dip in correlation is in November 2022. This was none other than the FTX collapse, the staggering implosion sending shockwaves through the crypto industry. At the same time, stocks actually advanced significantly as softer inflation data cropped up and optimism increased around the future path of interest rates. Cue the big dip in correlation. 

Therefore, there have been two periods of notable, and very large, decorrelations. Both of these occurred as crypto melted down, independently of the stock market. If you look closely over the last year – I have shown the correlation over the last year below – you will see another big deviation in the summer of 2022 when crypto “bank” Celsius shut withdrawals. 

And most importantly, the correlation has come back up swiftly every time. Including in March, when Bitcoin outperformed in the aftermath of the banking crisis. 

But, did it really outperform in March? The correlation above remained relatively high, certainly nowhere near previous episodes of decorrelation – and a lot more brief. Sure, Bitcoin raced upward further than the Nasdaq post-SVB, but it also fell further prior to the guarantee that deposits backing the second largest stablecoin, USD Coin, were safe. In reality, Bitcoin did what it has been doing – sold off more aggressively and then bounced back stronger. Because, well, it is riskier.  

Besides, the elephant in the room is the Federal Reserve. Markets have been moving off expectations of Fed policy all year long, and this was the true cause of the movement in March, as well as this week. 

With SVB’s collapse, the market reacted to the announcement of a large liquidity injection by the Fed, as well as the expectation that rates could not be hiked as much in future as a result of the creaking banking system. These are both good things for risk assets and so Bitcoin rose. Again, not because of any potential downfall of the fiat system. 

Not to mention, these banking problems were borne out of duration risk management, completely distinct to the banking issues of the GFC in 2008, which were a full-blown insolvency crisis built upon terrible underlying assets (subprime mortgages). Today, the banking crisis is still a crisis, but a regional one borne out of the most aggressive hiking cycle in recent memory, which has seen bank assets dropping in value and deposits pulled to take advantage of those higher rates elsewhere, leading to an unsustainable bank run as confidence evaporates. 

We have seen similar developments again this time around, as First Republic Bank fell last week after revealing it saw over $1 billion of withdrawal requests last quarter. 

Again, the market reacted to these things breaking by saying: “OK, the Fed cannot hike much more. This is good for risk assets”. Looking at Fed fund probabilities, there is the expectation of a 25 bps hike today (May 3rd) and then….nothing. The market is viewing this as the final hike. 

So, it is important to keep track of lurking variables (interest rate policy) when assessing correlations and trying to garner why Bitcoin is moving. For the time being, the numbers are pretty clear, and the conclusion is unequivocal: Bitcoin is trading like a risk asset. Perhaps we don’t even need to look at correlation. Take a glance at the below chart plotting Bitcoin’s returns since the start of 2022 against the Nasdaq. Do you really want to argue that these assets are uncorrelated?

The numbers speak for themselves. Again, this is not speculating about what will happen in future. Tomorrow, Bitcoin could go to $1 million and the Nasdaq could go to zero for all I care. Bitcoin may one day reach that uncorrelated store of value status. But for now, the numbers are clear: it is trading like a risk asset. 

The post Bitcoin still trading like a risk asset, despite claims of decoupling amid banking crisis appeared first on CoinJournal.

Bitcoin, Ether eye new move as stocks plummet on fresh bank fears

  • Bitcoin (BTC) and Ethereum (ETH) prices rose nearly 2% respectively as stocks plunged.
  • The S&P 500 was down 1.5% as two bank stocks plummeted.
  • BTC and ETH gains saw altcoins in the top 10 cryptocurrencies by market cap up.

Bitcoin (BTC) price moved above $28,500 again on Tuesday, rising more than 2% in early morning trades during the US trading session. The upside was yet another attempt by Bitcoin bulls to establish a fresj footing in the key price range.

Elsewhere, the price of Ethereum (ETH) rose above $1,860 to hit a new 24-hour high as crypto spot markets climbed. The Ether token was 1.9% up at the time of writing, gains that were being mirrored across the top 10 cryptocurrencies by market cap list.

BTC and ETH have traded to year-to-date highs above $31,000 and $2,100 respectively.

Stocks tank on bank fears

US stocks opened lower on Tuesday as stock prices of another two US banks plunged amid the latest turmoil in the banking sector. The S&P 500 was down 1.5% while Nasdaq was shedding 1.3%.

After share prices of First Republic Bank fell in the lead up to its takeover by JPMorgan, Tuesday saw prices of Pacwest (PACW) and Western Alliance (WAL) stocks bleed massively.

At about 12:30 pm ET, the PACW and WAL share prices were down 26% and 20% respectively.

The two bank stocks had plummeted more than 30% earlier as investor concerns around the turbulence within the US banking system resurfaced following the losses that followed the collapse of Silicon Valley Bank.

Also on investors’ minds this week is the Fed’s meeting that kicked off on Tuesday. While the market has the anticipated 25bps interest rate hike baked in for after the FMC meeting, what the central bank says in relation to what next is seen as key.

Economist Mohamed A. El-Erian, commented on the market outlook, stating via a tweet:

The roller coaster continues with, this time around, a 20 bps drop in the yield on 2-year Treasuries.  With such a key market segment continuing to be in urgent need of stabilization, it remains to be seen if the Fed serves this function tomorrow or, instead, is again a source of volatility.”

Barry Knapp of Ironsides Macroeconomics says the Fed’s approach to the inflation question is fraught and dubious. The central bank has to consider what the market is telling it. He shared his views in an interview with CNBC’s Squawk Box.

The post Bitcoin, Ether eye new move as stocks plummet on fresh bank fears appeared first on CoinJournal.

Shiba Inu (SHIB) and Aptos (APT) price outlook as Bitcoin (BTC) tests resistance near $30k

  • Bitcoin’s dip below $30,000 and subsequent retest of resistance above$29k highlights the past week’s top coins outlook.
  • Shiba Inu (SHIB) price is below its 50 and 200 MA but analysts are bullish on SHIB given overall sentiment and network growth.
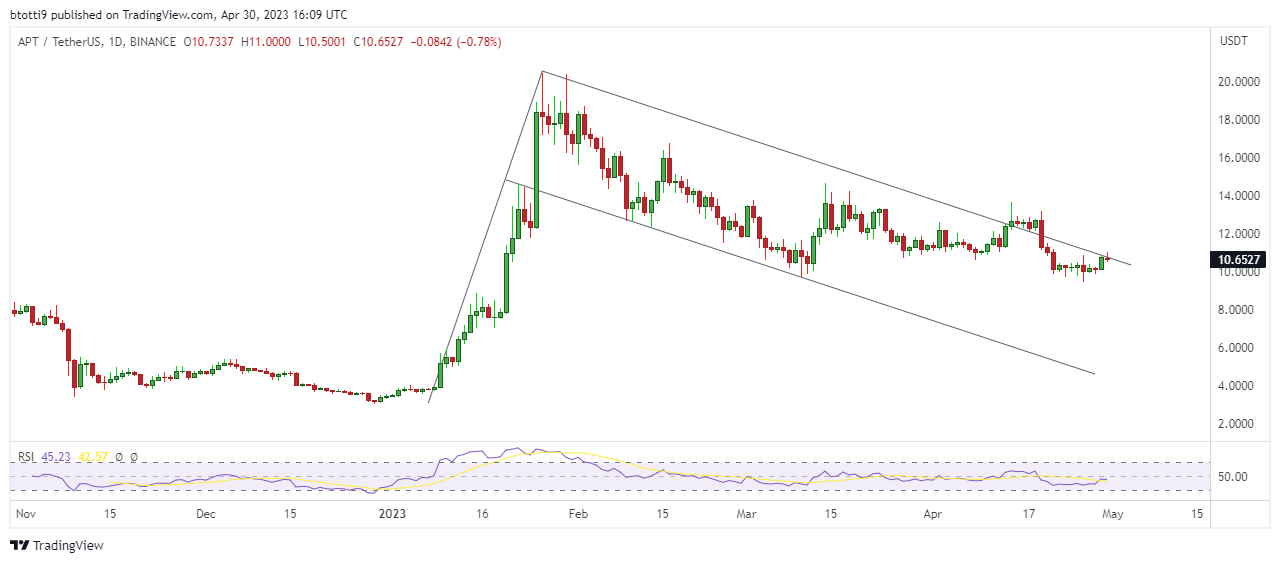
  • Aptos (APT) price has formed a massive bull flag pattern that could see APT explode to new highs in 2023.

The cryptocurrency market continues to see significant volatility as prices of various tokens fluctuate near key levels. Bitcoin (BTC) price fell to around $27,200 this past week and saw the global cryptocurrency market cap drop from above $1.34 trillion to $1.25 trillion amid broader sell-off pressure.

BTC price is however back above $29,000 and has retested resistance near the psychological $30k level this weekend.

At the same time, several altcoins that have recently seen dramatic declines look positioned for fresh moves, with cryptocurrency bulls buoyed by fresh turmoil in the banking sector with troubles for US bank First Republic.

Here’s the price prediction for Shiba Inu (SHIB) and Aptos (APT).

Shiba Inu (SHIB) price prediction

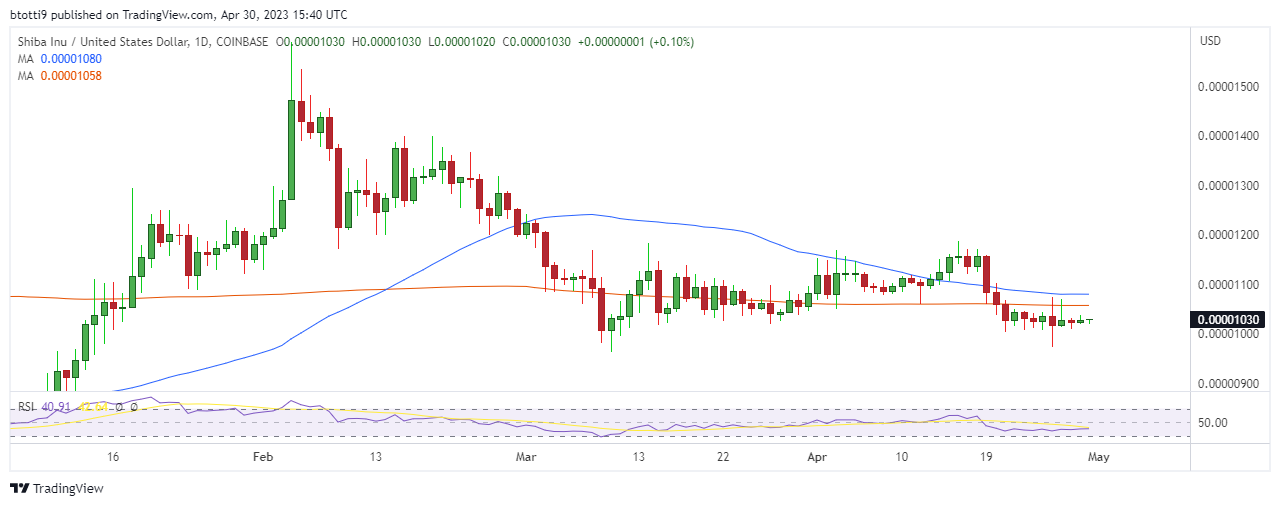
Shiba Inu price is down nearly 10% in the past two weeks, having traded lower from highs above $0.000011 recently.

SHIB currently trades below its 50 MA and 200 MA, while the daily RSI is below 40 to suggest bears might have a slight advantage.  

Shiba Inu (SHIB) daily price chart. Source: TradingView

But the 16th ranked cryptocurrency, which remains one of the top memecoins with a market of $6.1 billion, has a growing community buoyed by the success of the testnet for layer 2 protocol Shibarium. 

On-chain data shows the protocol has enabled over 194,000 transactions and seen over 100,000 wallet interactions.

If an upside flip in the price amid new buy Shiba Inu pressure, the main short term target will be the $0.000035 level. The 2021 all-time high provides another key level and a move to $0.01 could be the Holy Grail of the upcoming bull cycle.

Aptos (APT) price prediction

Aptos (APT) is a new layer 1 blockchain network that’s benefitted from massive investment by venture capitals. The Aptos mainnet went live recently and the demand for the native APT token saw the price rally to the YTD peak of $19.92 in January.

Aptos (APT) price daily chart. Source: TradingView

Currently trading around $10 has the APT/USD pair roughly 46% off the January highs. However, analysts remain bullish on the Aptos price.

Crypto analyst Captain Faibik recently highlighted Aptos bullish flag pattern. If a breakout follows, a move to $20 in the short term could be one of the main targets. 

Meanwhile, this Aptos price prediction for the medium term sees a potential burst to a new all-time high.

The post Shiba Inu (SHIB) and Aptos (APT) price outlook as Bitcoin (BTC) tests resistance near $30k appeared first on CoinJournal.

CFTC wins a record $3.4B penalty payment in a Bitcoin-related fraud case

  • This is the largest fraud case involving Bitcoin that CFTC has cracked so far.
  • The case involved the CEO of Mirror Trading International Proprietary Limited (MTI).
  • Half of the $3.4B will go toward providing restitution to victims of MTI’s fraudulent activities.

A Texas court has ordered Johannes Steynberg, the CEO of Mirror Trading International Proprietary Limited (MTI) to pay a $3.4 billion penalty in connection with a large-scale fraud case involving Bitcoin.

According to the CFTC allegations, Steynberg engaged in an international fraudulent multilevel marketing scheme (MLM) to ask for bitcoins from the public for an unregistered commodity pool operated by the South Africa-based company MTI.

Steynberg who was controlling MTI and the company falsely claimed to trade off-exchange retail forex through a proprietary “bot” or software program between May 2018 and approximately March 2021.

The final judgment read:

“Either directly or indirectly, the defendants misappropriated all of the Bitcoin they accepted from pool participants.”

According to the CFTC Steynberg, individually and as the principal and agent of MTI, accepted at least 29,421 bitcoins, valued at over $1.7 billion at the time. The bitcoin was obtained from at least 23,000 individuals in the US and other countries around the world. The individuals were tricked to participate in the commodity pool although MTI was not registered as a commodity pool operator (CPO), as required by the law.

Steynberg arrest

Steynberg was arrested in December 2021 and has been held in Brazil on an Interpol arrest warrant since then.

Besides the recent charges against him by the CFTC, Steynberg is also permanently banned from registering with the CFTC or trading in any CFTC-regulated markets.

Restituting MTI’s victims

Half of the $3.4 billion penalty will go towards providing restitution to the victims of MTI’s fraudulent activities. The other half is a civil penalty, which is the highest civil penalty to be ordered in any CFTC case.

The CFTC has however conceded that “orders requiring payment of funds to victims may not result in the recovery of any money lost because wrongdoers may not have sufficient funds or assets.”

The post CFTC wins a record $3.4B penalty payment in a Bitcoin-related fraud case appeared first on CoinJournal.

Bitcoin supply is dwindling, yet volatility will be the biggest benefactor


Key Takeaways

  • Long-term holders are accumulating Bitcoin, with two-thirds of the supply stagnant for over a year
  • Our Head of Research, Dan Ashmore, writes that liquidity on the demand side is also drying up, with order books thin and stablecoins fleeing exchanges
  • This will kick up volatility in the short-term, leaving Bitcoin open to aggressive moves to both the upside and downside
  • Long-term the impact of a dwindling supply is a different discussion, but for now, risk is elevated in the already-risky crypto markets

A lot is made of the demand for Bitcoin. Are institutions giving up on it following a disastrous 2022 that saw the entire crypto sector go up in flames? Is the market moving back in now that interest rate forecasts have softened following the relentless rate hikes over the past year?

But rather than the demand, it is the supply of Bitcoin that is often the more intriguing to look at. Famously sporting a fixed cap of 21 million coins, Bitcoin’s supply schedule is coded into the underlying blockchain. This quality has given rise to a million different theories around the future place – and price – of Bitcoin in the world. 

But there is another interesting analytical angle to Bitcoin: before the anonymous Satoshi Nakamoto launched Bitcoin in 2009, the world never had an asset that provided so much visibility over the supply distribution. The nature of the blockchain is that, while the individual holders are anonymous, the distribution of all coins is available for the world to see at all times. So, let’s have a look. 

Long-term holders are accumulating Bitcoin

Central to many Bitcoin bulls’ long-term thesis is the idea that long-term holders will suck up supply, leading to an inexorable price rise. 

Looking at current holdings, two-thirds of the supply has not moved in a year. That is certainly a large number, and we will get into what that means in the next paragraph. Pushing the timeline further out, over half the supply (53.6%) has been stagnant for over two years, 39.7% has not moved in 3+ years, and 28.6% has been idle for 5 years or longer. 

What does this mean for price?

These are large numbers by any stretch. It is impossible to compare them to other asset classes, given that none are trackable on a ledger like the blockchain. Perhaps only commodities such as precious metals can compete with the above numbers, yet that is only speculation. 

But what does it mean? Is this a bullish sign? Well, yes and no. The immediate conclusion is that less supply means less demand is needed to push the price up, and the cap at 21 million Bitcoins certainly means if that demand keeps rising, the price has nowhere to go but up. 

However, there are mitigating factors here. The first is the reality that some of the above “long-term holders” are in fact just lost coins, be it through people who have passed away, forgotten about their coins or lost access to their wallets. 

Bitcoin creator Satoshi Nakamoto is one of those, the mysterious enigma holding approximately 1.1 million bitcoins, equivalent to a mammoth 5.2% of the supply. None of his/her/their coins have moved since they were mined back in the first eighteen months of Bitcoin’s existence. 

Not to get too tangential, but below is the value of Nakamoto’s holdings over the last 13 years, assuming a stash of 1.1 million Bitcoin from mid-2010. That is a lot of capital that holders must surely hope never floods the market. 

Volatility to rise with less liquidity 

Regarding the impact of these large stashes of Bitcoin which are “removed” from circulation, the greatest impact – for now, at least – may be on the volatility rather than price. 

In the following chart, I have plotted the amount of Bitcoin sitting on exchanges, currently at a 5-year low. 

Not only is the amount of Bitcoin on exchanges dwindling, but stablecoins are doing the same. Over half of the balance of stablecoins have flooded out of exchanges since December. 


This means liquidity on both the demand and supply side of Bitcoin is thin – and the same conclusion will be reached if an order book is downloaded from an exchange. Liquidity has dried up hugely, especially since FTX went under in November.

This lack of liquidity only serves to jack up the already sky-high volatility in the Bitcoin market, exacerbating moves to both the upside and the downside. This is part of the reason why volatility recently spiked to its highest level since mid-2022, and also a factor in Bitcoin’s massive run-up this year. 

By definition, it takes less to move a thin market, and with forecasts around the future path of monetary policy shifting to a more optimistic stance in recent months, Bitcoin has moved up with minimal resistance in its path. 

While the supply-side dry-up is intriguing in the long-term, looking into that with regard to Bitcoin’s future performance is a different discussion entirely.  In the short-term, capital has fled crypto markets at an unprecedented pace, and we are now in a spot where the market is primed for violent moves in either direction. Like always in crypto, the short-term is difficult to predict, however, and the risk remains extreme – perhaps even more so currently than normal.

The post Bitcoin supply is dwindling, yet volatility will be the biggest benefactor appeared first on CoinJournal.