Terra (LUNA) is in free fall right now – Time to buy?

The crypto winter in January has seen many coins lose value. However, even though we are starting to see some price stability in the broader market, Terra (LUNA) appears to be going against the trend. The coin is quite literally on free fall right now so it begs the question, is it a good buy? Well, more on that below but here are some highlights:

  • In the last month alone, LUNA has seen a sharp decline, falling by nearly 50% during the period.

  • At press time, LUNA was trading at $45, down 8% for the day and down nearly 25% over the past week.

  • The negative sentiment, mostly associated with Terra’s connections with Magic Internet Money (MIM), will continue in the near term.

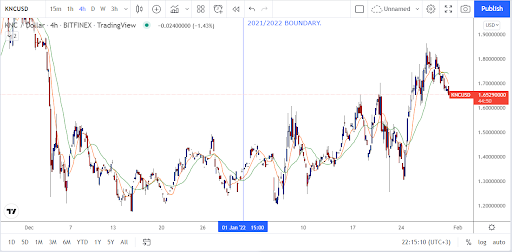
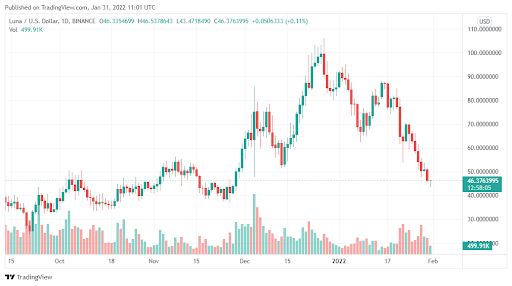
Data Source: Tradingview.com 

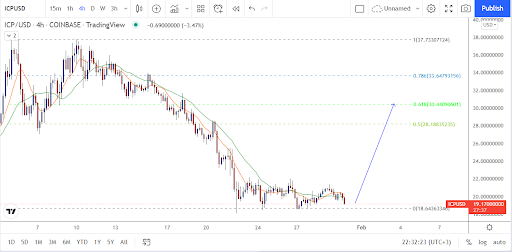
Is a recovery in sight for LUNA?

Right now, it is quite possible that the free fall will continue at least in the foreseeable future. Besides, some investors are raising concerns that the Terra ecosystem could be in danger due to its association with the Anchor Protocol and MIM. 

Also, we are still not sure if the storm has passed in the crypto market. Even with gains in the last few days, there is still a lot of downside risks here that could have a massive impact on the LUNA price action. For this reason, we expect the coin to slip further in decline over the coming days.

Is it time to buy Terra (LUNA)

As a major coin in the crypto market, LUNA is of course worth having. But as the sell-off continues, it may not be the most ideal time to get in right now. Give it a week or so and see how the price plays out. If it dips even further, then you can buy and avoid any serious downtrend. After all, from a long-term point of view, LUNA is a must-have.

The post Terra (LUNA) is in free fall right now – Time to buy? appeared first on Coin Journal.

Interested in the new Smart Contract Blockchain cryptocurrencies? FTM vs. AVAX – Which is more promising?

 Smart contracts made blockchain technology explorable and usable. It allowed the creation of apps, digital assets, organizations, etc. Of the numerous blockchains, two new ones are gaining traction in the crypto space. They are Fantom and Avalanche.

 Fantom was launched in December 2019 by Michael Kong to support dApps and digital assets, among others. It uses Asynchronous Byzantine Fault Tolerant (aBFT) proof-of-stake consensus algorithm (Lachesis) to implement security, low transaction fees, and high throughput. This mechanism uses a modular consensus layer that can be integrated into any network. It also has Fantom Virtual Machine that supports project development on the ecosystem.

 Avalanche was created in September 2020 by Ava Labs to support the integration of various DeFi ecosystems. It has three subchains, including Exchange Chain (X-Chain), Platform Chain (P-Chain), and Contract Chain (C-Chain). The X-Chain allows the creation and exchange of assets, the P-Chain is where validators and subnets converge, and the C-Chain aids the execution of EVM and smart contracts. It operates on Avalanche and Snowman consensus protocols.

 Both blockchains are scalable, secure, decentralized, and have low transaction fees. They have wallets where their native tokens can be stored and staked while maintaining compatibility with other wallets. Unlike Fantom, which has 22 members, Avalanche is backed by Ava Labs with over 100 members. Due to Fantom’s compatibility with Solidity and Vyper, it can easily integrate various projects into its ecosystem.

 Although they are both scalable, Fantom is than Avalanche with a finality period of one second. Also, Fantom has a fully implemented on-chain governance where FTM holders can participate in governing and propose changes on the network. However, it costs more to be a validator on Fantom.

 The price of FTM rose by 13,500%, while that of AVAX rose by 560% last year, according to CoinGecko. This can imply that although it is highly adopted, it is still undervalued. The adoption of Fantom blockchain is increasing right now, which would positively affect its price in the long run. So, in this case, the better investment is Fantom and FTM costs $2.08 as of today.

 Before you join the Fantom wagon, go ahead and do an in-depth analysis. After doing that, please deal wisely and put what you can lose.

The post Interested in the new Smart Contract Blockchain cryptocurrencies? FTM vs. AVAX – Which is more promising? appeared first on Coin Journal.

Kyber Network (KNC) outperforms most cryptocurrencies with a 57 percent gain in January

  • Kyber Network (KNC) outperformed the market with a 50 percent+ monthly gain after the introduction of Kyber 3.0 and interoperability throughout several decentralized exchanges.

  • Volatility appears to rule supreme in the cryptocurrency market, and worry, anxiety, and skepticism are at an all-time high. 

  • It is difficult for any project to emerge above the cacophony and achieve positive price increases, although a few projects are demonstrating fortitude during the present slump.

KNC is a decentralized exchange (DEX) that operates in a multichannel context and aggregation technology that connects decentralized finance (DeFi) apps and their customers to liquidity sources that offer the highest rates.

The price of KNC has risen 57 percent from reaching a low of $1.18 on Jan. 6 to a continuous peak of $1.87 on Jan. 27 notwithstanding this weakening in the crypto market.

Another factor contributing to KNC’s bullish momentum is the continuing inclusion of new decentralized trading systems into the Kyber Network ecosystem.

Source – TradingView

As a result of the latest developments, the KyberSwap protocol currently supports over 40 DEXs and 31,000 liquidity pools throughout six main blockchain systems. The only other initiatives with comparable availability are ZRX, which has 105 exchange entries, and Uniswap, which has 76.

KNC is widely available on exchanges

KNC is the second-most-present DEX token in terms of exchange availability, and it is now accessible on 80 different exchanges.

There is a positive outlook for KNC on Jan. 22, before the latest price spike. It is based on a score that comprises an algorithmic assessment of past and present market circumstances based on various data sources such as market mood, trading volume, latest price changes, and Twitter traffic. 

The Score for KNC surged into the green and reached a peak of 79 on Jan. 22, roughly 35 hours before the price gained 44 percent over the following three days, as seen in the chart above.

The post Kyber Network (KNC) outperforms most cryptocurrencies with a 57 percent gain in January appeared first on Coin Journal.

ICP is expected to go next after falling below current lows

  • Internet Computer’s token ICP is trading at $20.7. 

  • The $28.5 level has been a lengthy support zone, and the price has now fallen through it. 

  • Price wants liquidity, and ICP may find it in the $28 range in the coming weeks.

It looked to break the market framework in early January, but the severe selling pressure subsequently has caused ICP to reach a new record of lows at $19.1, close below the $20.9 lows established in late December.

Two pairs of Fibonacci retracement lines were developed for various ICP movements in the last several months. They exhibited solid convergence around $39.7 and identified the $26.9-$29.7 range as one where sellers might move in with power once again.

Source – TradingView

The market structure, however, stayed gloomy. While there was a significant rise from $20.7 to $38, it was quickly followed by a massive drop. The price fell below the December lows, which was not good for the bulls.

A rise to $28 is possible, but whether it is rejected there or can advance higher to enter a demanding sector remains visible.

Another intriguing fact was that both Fibonacci groups of levels provided a 27.2 percent extension level at $10.7, which might be the price ICP trades in the future months. It is uncommon for cryptocurrencies to lose over 99 percent of their value when the initial frenzy wears off.

RSI Oversold

The RSI was rising from the oversold area. Still, it remained below neutral 50, which indicated that the bearish trend had not yet been broken, with the moderate 50 regions reviewed before a probable rejection.

The Cumulative Delta Volume revealed some demand underlying ICP’s rise from $20 to $36, revealing severe selling pressure in recent weeks. ICP will most likely place a premium on the $28 range in the following weeks.

The post ICP is expected to go next after falling below current lows appeared first on Coin Journal.

Decentraland (MANA) could rise after finding support at $1.75

  • On Saturday, Decentraland (Mana) expands the consolidated movements.

  • Expect the rally to continue beyond the $2.50 to $3.0 demand zone.

  • A breach below $2.03 would invalidate the bull’s hypothesis.

The price of Decentraland has remained stable at current levels, making a hammer candlestick on January 22. Although there is less purchasing activity in cryptocurrencies, they are still building a bullish setup. MANA/USD is now trading at $2.31, up 1.23 percent on the day. The current market capitalization of MANA is $4,304,417,127 USD, with a current circulation of 1,824,500,835 MANA coins and without maximum supply.

Decentraland (MANA) prepares for a U-turn

The price has been on a downward trend on the daily charts since testing the 50-day moving average on December 27. The price had already dropped from all-time highs of $5.91 on November 25, a total value drop of 48 percent. Investors challenged the $3.06 level three times, a support-turned-resistance level. As a result, it is a critical trading level.

Source – TradingView

The daily relative strength index (RSI) is now trading at 38, with a bullish crossing suggesting that the pair is poised to go higher. The declining trend line from the stated line, which is at $2.50, is the immediate resistance.

In addition, the bulls would dig deep to reclaim the psychological $3.06 level. This will also coincide with the 50 DMA re-test. A clear break above this level might entice additional investors to join the renewed upward trend.

Conversely, the bullish thesis will be invalidated if the price falls below the $1.98 horizontal support line. The $1.50 level would be the objective for sellers. More fall is likely targeting the descending channel’s bottom trend line at 1.32. The last time these levels were witnessed was in October.

The post Decentraland (MANA) could rise after finding support at $1.75 appeared first on Coin Journal.