PancakeSwap prediction as price overcomes slump and posts gains

  • PancakeSwap has narrowed the losses in the past one week to 2.45%

  • The decentralized exchange protocol is backed by Binance

  • CAKE faces resistance at $4.12 but could break out if the momentum remains strong

PancakeSwap CAKE/USD is a cryptocurrency to watch as prices start to shrug over the latest losses. The cryptocurrency’s losses in the last one week stood at just 2.45% as of Wednesday. The small losses were after the last three days’ recoveries. The token trades at $3.92 after touching a low of $3.6 on August 20. The token is stalling but still pointing higher.

PancakeSwap has been making strides in the DeFi sector despite ranking below its peers. The decentralized exchange is backed by Binance, the largest crypto exchange. Binance Labs has also invested in PancakeSwap, a further indication of the trust it has earned. Its native token has, however, been subdued, and its price has largely been driven by market momentum.

CAKE approaches resistance as price overcomes recent drop
Source – TradingView

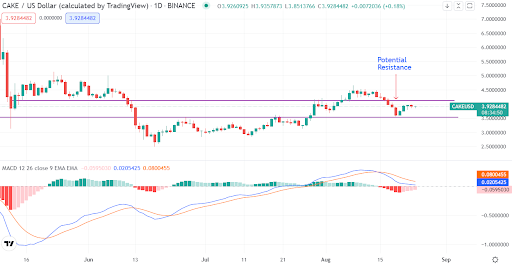
On the daily chart, CAKE is bullish below the $4.12 resistance. The token is keeping an uptrend which started in mid-June. The momentum indicator shows that the token’s latest bearish momentum is weakening. 

CAKE will imminently hit the resistance as bull strength remains in place. A potential breakout will occur if the sentiment improves and CAKE continues to attract buyers. Still, at the low valuation, CAKE is attractive to long-term buyers.

 If CAKE breaks above $4.12, the next level to watch is $4.8. We also need to monitor the prevailing crypto sentiment since CAKE has been following the market.

Summary

CAKE is recovering from the recent slump. The token eyes $4.12 resistance as the next level. A breakout of the resistance will depend on the crypto sentiment.

The post PancakeSwap prediction as price overcomes slump and posts gains appeared first on CoinJournal.

Terra Classic hits fresh bull-run but faces hurdle at key resistance

  • Terra Classic is up 4.97% in the past day

  • Sentiment about the project revival is driving positive gains

  • RSI is slightly above the neutral point

Terra Classic (LUNC/USD) has jumped 4.97% in the past day, tightening weekly losses to 10.17%. The live price is $0.0001025, and the current market capitalization stands at $672 million. LUNC, the native token of Terra Classic, crashed in May.

Terra Classic, formally known as Terra, occupied an important space in the blockchain space. Its high performance was based on strong price stability and usability. The crash intercepted the progress of the then seemingly promising crypto project.

The collapse happened after UST, a native stablecoin to Terra Classic, lost its peg to the US dollar. Community efforts to revive the project led to a new token, LUNA. The token also referred to as Terra 2.0, is currently trading at $1.75. Its value is much higher compared to that of the rebranded LUNC.

Nonetheless, LUNC is under bullish momentum. Aside from the price swings, attempts by the Terra community to restore the network seem to be bearing fruits. The blockchain has since convinced some dApps to develop on the blockchain.

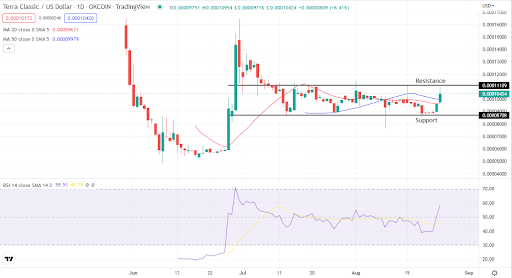
Terra Classic approaches $0.00011109 amid bullishness

Source: TradingView

According to the daily chart above, LUNC is on an uptrend. The token has established $0.00008708 as the reference support and $0.0.00011109 as the immediate resistance. LUNC is currently trading above the 20-day and 50-day moving averages.

Moreover, the indicators show that LUNC could continue with the trend. The RSI is at the 58 level. Much as the indicator is close to neutral, there are more buyers than sellers. However, LUNC could face resistance at $0.0.00011109.

Concluding thoughts

Despite Terra Classic bringing bitter memories of losses to investors, speculators are cashing in again. The token is approaching a key resistance level. Investors should remain patient until it clears above or close below.

The post Terra Classic hits fresh bull-run but faces hurdle at key resistance appeared first on CoinJournal.

Is Near Protocol about to recover the $4.2 level and become bullish again?

  • Near Protocol traded at $6 in mid-August, the highest since May

  • The token trades around the $4.2 support amid the latest declines

  • NEAR could turn bullish if it recovers $4.2 successfully

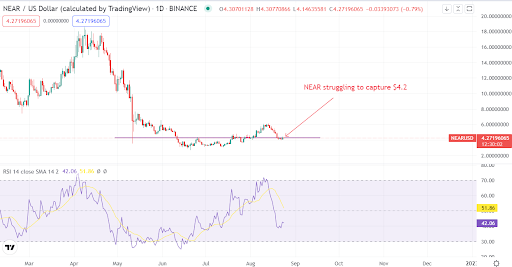
Near Protocol NEAR/USD traded at a monthly high of above $6 in mid-August. The last time the token hit such a high level was in May. However, recent weaknesses forced the token back to $4.0, slightly below or at the support zone of $4.2. As of the time of writing, NEAR was trading at $4.26. Although the price was sluggish, bulls were wrestling the bears. That offers a chance for the token to move higher should the price overcome the slump.

Near Protocol has been deriving momentum from recoveries in Ethereum. In particular, the anticipated Ethereum Merge has been boosting liquidity in Layer-1 protocols. Near Protocol has so far cooled as the Ethereum rally also slowed. However, we know that volatility may creep back as the September 15 date of the expected merge approaches. While we can’t ascertain how much the Merge will boost NEAR, investors would be good watching. A price recovery that keeps $4.2 intact will be a bullish catalyst.

NEAR trades at the support with no directional movement

Source – TradingView

A technical outlook shows NEAR struggling to maintain the $4.2 level. The token is near the oversold level but still has more room to fall. There is currently no directional movement, and we cannot rule out a further slump. 

Nonetheless, if the bulls keep $4.2 intact, the price could jump higher. The token should be keenly watched for the potential outcomes.

Summary

Near Protocol token is wrestling the $4.2 support. Bulls will take over if the price recovers from the support. If the price crashes below $4.2, bears will be in control. The token is one to keep a tab on.

The post Is Near Protocol about to recover the $4.2 level and become bullish again? appeared first on CoinJournal.

Watch $0.2 support as Fantom retraces amid consolidation

  • Fantom has dipped 4.71% in the past day and 23.51% in the past week

  • The token is currently retracing within a consolidation 

  • A dip below the support could open more sell trades

Fantom FTM/USD has been adversely affected by the bearish correction in cryptos. The token is down 4.71% in the past day, with weekly losses at 23.51%. Currently, FTM is trading at $0.2905. Despite the negative trend, Fantom is one of Ethereum’s rivals with strong fundamentals.

Fantom is a highly scalable independent decentralized project. The blockchain is suitable for decentralized applications and cryptocurrencies. With its lower transaction fees and Fantom Opera’s high throughput, it is one of the fast-paced blockchains.

DeFi users, enterprise apps, and Ethereum virtual Machine developers are currently flocking the network. FTM, which powers staking and governance functions, is yet to reap the gains of the network’s growth. The token has remained at the center of crypto volatility. 

FTM has lost a whopping 91% from its highest point year to date. The short-term technical outlook shows consolidation amid a weak momentum.

FTM consolidates sideways in a bearish market

Source: TradingView

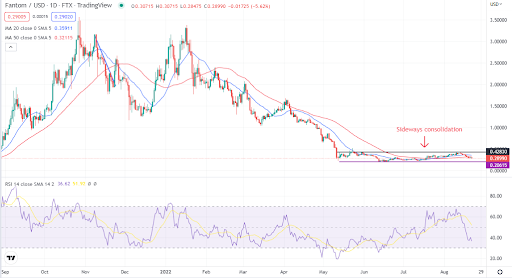
According to the daily chart, FTM has been locked in a consolidation pattern. The token has been trading between $0.2 and $0.42 price levels. The pattern has been maintained for about four months.

Currently, FTM is on a retracement amid a bearish momentum. The 20-day and 50-day moving averages offer resistance to the upside. The two averages are possible points of consolidation or resistance in the case of a trend reversal.

The RSI is currently at 36, the lowest level since June. Despite the indicator approaching the oversold zone, FTM should overcome the $0.42 resistance level to become bullish. If the reverse happens, the token could retest lower levels.

Concluding thoughts

FTM faces a strong bearish momentum, with more than 23% weekly losses. The token has remained in consolidation for longer. The token could trade lower if the $0.2 support level fails to hold.

The post Watch $0.2 support as Fantom retraces amid consolidation appeared first on CoinJournal.

Should you buy Sandbox SAND at the $1.03 support?

  • Sandbox failed a break out at $1.3 and has retraced to a support

  • Price weakness emanates from the general crypto mood and lack of Sandbox developments

  • SAND remains vulnerable unless potential price catalysts come up

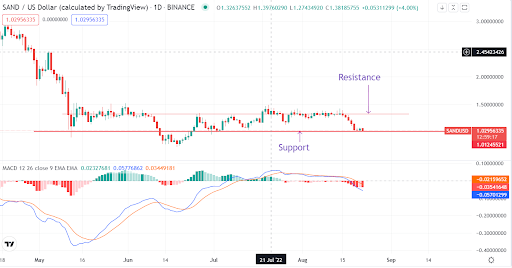
Sandbox token SAND/USD looked likely to take new heights as the price hovered around $1.3. Price consolidated at the resistance level for weeks, but neither bulls nor bears seemed to win the battle. Since most other cryptocurrencies were surging, that gave hope that bulls would eventually triumph. Bears seem to have taken control as the price has dipped to $1.03. That is a potential demand zone but will buyers push the token higher?

Sandbox does not look promising at the current level. First, Sandbox has depended on the momentum of the crypto sector lately. The momentum is currently weak. Before the sentiment improves, SAND could weaken further. Secondly, projects building on the metaverse has slowed lately. Although a great opportunity exists for the metaverse sector, investors are interested in current developments. The lack of clear fundamentals from the metaverse sector could be a blow to the short-term recoveries of SAND.

Sandbox token slides to $1.03 support in a bear market

Source – TradingView

Technically, Sandbox is bearish. The momentum indicator shows that the price is extremely bearish at the key support of $1.03. No price action to show that the price is about to recover at the support. Consequently, SAND is vulnerable if momentum fails to improve quickly. Investors should not buy the token at the support but should watch price action and general sector mood. If SAND loses the $1.03 support, the token could slide to $0.85.

Summary

Sandbox token remains vulnerable at the $1.03 support. The lack of clear fundamentals and momentum is a catalyst for further bear weakness.

The post Should you buy Sandbox SAND at the $1.03 support? appeared first on CoinJournal.