Is Shiba Inu now bullish after an 8% surge?

Shiba Inu (SHIB/USD) made an intraday 8% gain on Wednesday to trade at $0.000009. The rise reflected a slightly improved crypto sentiment. Most cryptocurrencies were trading in the green territory, with Bitcoin and Ethereum up 5% and 7%, respectively. However, there are some notable developments for the Shiba Inu network.

On November 22, Shiba Inu lead developer Shytoshi Kusama reported positive cryptocurrency news. In a Twitter post, Kusama said that Shiba Inu had been invited to work with the World Economic Forum on global policy. That potentially means a metaverse-related one, with Shiba Inu already entering the space. The post solicited views from the Shiba community on whether cryptocurrency should work with the global body. An overwhelming 65% of respondents supported the idea. 

Onboarding the WEF is positive for Shiba Inu as it works to build a real utility for its meme-labelled cryptocurrency. The development is, of course, long-term, and it needs waiting to see how it unfolds. Meanwhile, the amount of SHIB held by Ethereum’s largest whales has fallen below $70 million. However, the number of SHIB token holders recently increased by 6,000. But how bullish is the meme token?

SHIB is recovering from near-oversold levels
SHIB/USD Chart by TradingView

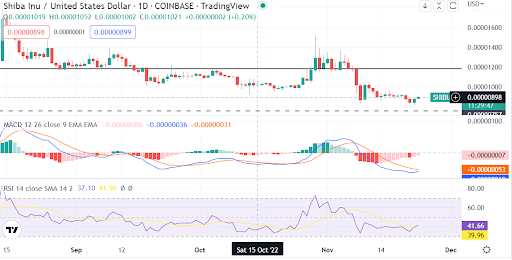
The general trend for SHIB is bearish on the daily chart. The MACD indicator shows bear momentum, although the weakness has slightly cooled off.

SHIB is also recovering from a near-oversold RSI reading of 35. Each time SHIB has approached this level, the token has recovered or consolidated since June. Still, the current RSI reading of 41 is below the midpoint, signalling that sellers are still many.

How sustainable is SHIB recovery?

A recovery near the oversold region is positive for SHIB price. However, the trend is still bearish, and SHIB is vulnerable. For sustainable gains, SHIB must overcome a minor resistance at the $0.000009 trading level. A recovery above this level will keep $0.00001 and $0.000012 levels in sight.

If SHIB fails the potential recovery, the level around $0.000007 will be the likely support to the downside. 

Where to buy SHIB

eToro

eToro is a global social investment brokerage company which offers over 75 cryptocurrencies to invest in. It offers crypto trading commission-free and users on the platform have the option to manually invest or socially invest. eToro even has a unique CopyTrader system which allows users to automatically copy the trades of popular investors.

Buy SHIB with eToro today

OKX

OKX is a top cryptocurrency exchange which offers over 140 cryptocurrencies to invest in. OKX takes customer security very seriously, they store almost all of their clients‘ funds in cold storage, and the exchange is yet to be hacked. On top of this, the exchange offers very low fees and customers can even use their crypto as collateral for loans on the platform.

Buy SHIB with OKX today

The post Is Shiba Inu now bullish after an 8% surge? appeared first on CoinJournal.
Nest Protocol – what you need to know about the token that surged 50% in a day

Nest Protocol token (NEST/USD) traded up 50% on Tuesday before cooling slightly. The token saw increased trading volume, with a 24-hour change of positive 326%. We investigate more into this now exciting token and its protocol.

Nest Protocol functions as a web3 infrastructure platform. It facilitates the generation and programming of stochastic assets. The platform is built on Ethereum. NEST, an Ethereum-based token, runs the protocol. It helps meet the liquidity needs of the platform. The token also serves as a reward mechanism for users who provide accurate price quotes on the protocol.

Nest Protocol token is ranked #190 on CoinMarketCap with a total valuation of $76.64 million. The token has a circulating supply of 2.91 billion tokens, while its max supply is capped at 10 billion.

No clear fundamentals were driving the price of NEST. The token witnessed increased mentions on social trading platforms. Will the bubble burst?

NEST token price analysis amid increased retail interest

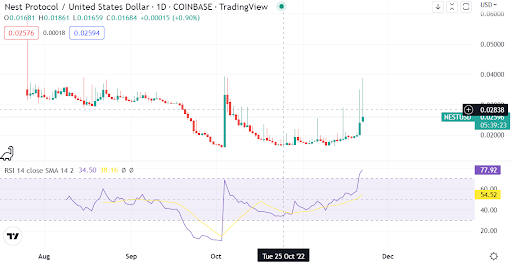
NEST Chart by TradingView

A technical outlook of NEST shows that the token is overbought, with the RSI at 77. The cryptocurrency met resistance at $0.038, resulting in the formation of tailed bars. 

Looking at the general trend, the price momentum of NEST is bearish. The cryptocurrency has been witnessing irregular bullish pop-ups that have been unsustainable. Consequently, a sharp correction could occur.

Should you buy NEST?

Buying NEST is speculative as the price lacks clear fundamentals. A potential bubble burst could occur after the intra-day gains as cryptocurrencies remain in a bear market.

For a sustainable bullish momentum, NEST must clear the resistance at $0.038. That will depend on clear fundamentals emerging that will support a higher price amid a bear crypto sentiment. On the downside, the level to watch is $0.016.

Where to buy NEST

Swapzone

Swapzone is a crypto exchange aggregator that operates as a gateway between the cryptocurrency community and exchange services. Swapzone aims to provide a convenient interface, safe user flow, and crystal-clear data for users to find the best exchange rates among the whole cryptocurrency market.

Buy NEST with Swapzone today

Huobi

Start Your Cryptocurrency Journey Today. Huobi Global has a variety of features that make it an ideal place to buy and sell digital asset.

Buy NEST with Huobi today

The post Nest Protocol – what you need to know about the token that surged 50% in a day appeared first on CoinJournal.

Sandbox SAND prediction as token hits a new low in the year

The Sandbox (SAND/USD) crashed by nearly 5% on Monday, extending its losing streak in the bear market. The loss took the token to a yearly low of $0.52 before recovering slightly. As it stands, the token of the Metaverse platform is under the control of bears.

It is not only SAND that is under pressure. Metaverse peers feel the heat of a very calm virtual reality space amid a prolonged crypto winter. This year’s activity is below par for a sector that was expected to witness unprecedented growth.

Take the case example of Horizon Worlds, the flagship metaverse for tech giant Meta. As of October, reports indicated that Horizon had amassed less than 200,000 monthly active users. Unless a miracle happens, Meta is unlikely to hit 500,000 MAUs by the end of the year, as initially projected.

As to whether the low activity in the metaverse is connected to the crypto winter, time will tell. At the moment, the metaverse is simply underperforming. The Sandbox token has, therefore, been in a prolonged downturn owing to fewer entities entering the nascent sector. Will the token set a new low?

SAND heading to $0.40 next?

SAND/USD Chart by TradingView

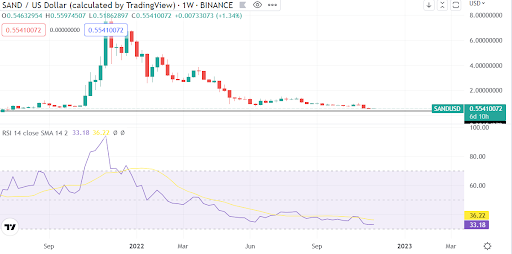
On the weekly chart, there is no clear bottom price for the Sandbox token. However, the area around $0.4, when SAND started to turn bullish, should remain of interest. That implies that SAND could fall by up to 30%. Nevertheless, looking at the candlestick price pattern, the bear market has been cooling.

When to buy SAND

SAND price is bearish and not attractive for a buy. Nonetheless, significant price declines are unlikely, and SAND could begin a reversal if the RSI hits the oversold levels. Still, the prevailing crypto sentiment should guide ascertaining a bullish reversal for the cryptocurrency.

Where to buy SAND    

eToro

eToro is a global social investment brokerage company which offers over 75 cryptocurrencies to invest in. It offers crypto trading commission-free and users on the platform have the option to manually invest or socially invest. eToro even has a unique CopyTrader system which allows users to automatically copy the trades of popular investors.

Buy SAND with eToro today

OKX

OKX is a top cryptocurrency exchange which offers over 140 cryptocurrencies to invest in. OKX takes customer security very seriously, they store almost all of their clients‘ funds in cold storage, and the exchange is yet to be hacked. On top of this, the exchange offers very low fees and customers can even use their crypto as collateral for loans on the platform.

Buy SAND with OKX today

The post Sandbox SAND prediction as token hits a new low in the year appeared first on CoinJournal.

Solana nears a single-digit price. Here is the price action and what you need to know

Anyone would have thought Solana SOL/USD would trade at a double-digit price, let alone a single-digit one? Unfortunately, that is the reality for the lovers of the once promising cryptocurrency labelled the Ethereum killer. Having hit a high of over $265 in November 2021, the SOL was touted as the next token to reach $1,000. It now trades at a mere $11, exactly one year since its all-time high. The cryptocurrency is yet to find a bottom, with technical indicators pointing to a price below $10.

While a bear sentiment is to blame for the significant SOL decline, recent woes reflect exposure to collapsed FTX. As CoinJournal reported, Alameda Research has significant holdings of SOL tokens. The exposure has seen Coin Bureau host “Guy” warning his 2.17 million subscribers on YouTube about SOL price.

The analyst expects the price of SOL to come under further pressure and fall a further 40%. He says that the token will suffer when FTX and Alameda dispose of their holdings in Solana to pay off creditors and other users. He further notes that the SOL situation could be worse, with the cryptocurrencies showing they are yet to bottom. The analyst is projecting an $8 SOL price. A technical outlook shows we could see an even lower price level for the cryptocurrency.

SOL crashing below an inside-bar pattern is a bear indicator

SOL/USD Chart by TradingView

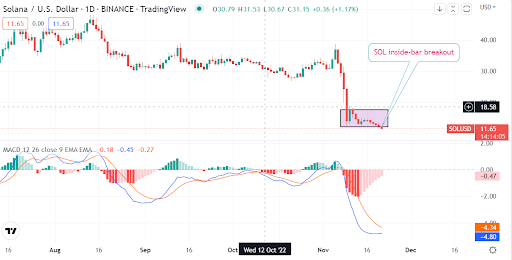
A technical outlook shows SOL bulls losing the battle at $12. The MACD indicator has pushed further into the bear zone. The indicator shows an increasing bear momentum.

Besides, SOL is initiating a bearish breakout from an inside bar pattern. Once confirmed, by the close of the daily candlestick, we should be ready to embrace a lower SOL price.

What next for SOL?

With weak momentum and a bearish inside bar breakout, SOL could likely head to a single-digit price. There is a potential 50% drop to the next likely support at $5. The level coincided with the start of bullish momentum in February 2021.

Where to buy SOL    

eToro

eToro is a global social investment brokerage company which offers over 75 cryptocurrencies to invest in. It offers crypto trading commission-free and users on the platform have the option to manually invest or socially invest. eToro even has a unique CopyTrader system which allows users to automatically copy the trades of popular investors.

Buy SOL with eToro today

Capital.com

Capital.com is a global broker which offers over 200 cryptocurrencies for its users. It comes with a range of features such as; great security, 24/7 support, demo accounts and a wide variety of assets. On top of that, it also has no inactivity, withdrawal or deposit fees, which makes it stand out from other crypto brands.

Buy SOL with Capital.com today

The post Solana nears a single-digit price. Here is the price action and what you need to know appeared first on CoinJournal.

Is Solana facing a catastrophic breakout from an inside-bar pattern?

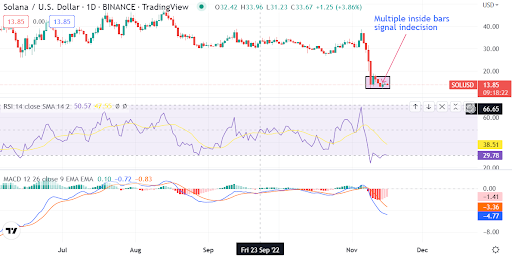
It’s an indecision moment as Solana trades at an oversold level of $13. The cryptocurrency has formed multiple pin bars at the level, indicating indecision in the market. A potential breakout to the downside could see SOL claim a single-digit price.

CoinMarketCap data shows that SOL has lost more than 25% in a week. The loss is among the highest among the cryptocurrencies in the top 100 bracket. Concerns that the Solana ecosystem has a huge exposure to the collapsed FTX and Alameda have been fueling the bear market. Alameda is believed to hold 50.5 million SOL worth $708 million. Amid the exposure, Solana founder Anatoly Yakovenko has maintained that the investment is unaffected.

SOL remains under the mercy of bears, who are increasingly active at the $13 price level. Here is the price outlook:

SOL is under pressure at $13 even as the price hits oversold levels

Technically, SOL is creating a support zone at $13. However, a likely bullish reversal looks unlikely as the token trades with weakening momentum. The formation of multiple inside bars at the crucial level suggests that buyers and sellers match the effort. 

SOL/USD Chart by TradingView

Turning to the RSI shows that SOL is oversold. An attempted recovery has been muted, with a further slip of the RSI reading to 29. The MACD indicator underlines a weak and worsening momentum.

Which way is SOL?

An inside-bar pattern can break on either side. An upside breakout will confirm a bullish reversal for SOL. However, a quick sell-off for SOL could occur if the breakout occurs to the downside. In such a case, the SOL price could touch $10 or below. 

With the weak sentiment, a bearish breakout carries a higher chance. Investors should be cautious about buying SOL at this level.

Where to buy SOL

eToro

eToro is a global social investment brokerage company which offers over 75 cryptocurrencies to invest in. It offers crypto trading commission-free and users on the platform have the option to manually invest or socially invest. eToro even has a unique CopyTrader system which allows users to automatically copy the trades of popular investors.

Buy SOL with eToro today

Capital.com

Capital.com is a global broker which offers over 200 cryptocurrencies for its users. It comes with a range of features such as; great security, 24/7 support, demo accounts and a wide variety of assets. On top of that, it also has no inactivity, withdrawal or deposit fees, which makes it stand out from other crypto brands.

Buy SOL with Capital.com today

The post Is Solana facing a catastrophic breakout from an inside-bar pattern? appeared first on CoinJournal.