ApeCoin price falls sharply as NFT sector momentum fades

  • The ApeCoin token has shed 12% of its price value in the past 24 hours.
  • Pudgy Penguins and Blur have also dipped as NFT sector tokens suffer profit-taking.
  • APE faces potential deeper losses to $0.081 unless fresh catalysts emerge.

ApeCoin (APE), the governance token powering the ApeCoin ecosystem tied to the Bored Ape Yacht Club (BAYC) NFTs, has seen a sharp reversal.

After riding a brief NFT sector rally, APE plunged 12% over the past 24 hours and was trading around $0.14 at the time of writing.

The decline erased much of its intraday gains, during which the token briefly surged above $0.18. The losses highlight the volatile nature of meme and NFT-linked tokens amid broader market profit-taking.

APE pares gains after sector rally fades

ApeCoin’s downturn follows a broader NFT sector rally that lifted several related tokens before momentum faded. The token surged over the past week alongside peers such as Pudgy Penguins’ PENGU and Blur’s BLUR, driven by renewed hype around non-fungible tokens.

PENGU, for instance, climbed as the Pudgy Penguins NFT collection’s floor price spiked, drawing speculative inflows into the ecosystem. BAYC floor prices also rose during the rally.

However, the momentum proved short-lived. Both PENGU and APE have since given up a significant portion of their gains, with PENGU’s daily trading volume dropping 50% to $132 million.

The pullback reflects profit-taking after NFT-linked assets briefly outperformed the broader market.

APE’s retreat mirrors this trend, as traders exited positions amid fading enthusiasm.

Data from CoinMarketCap shows APE’s 24-hour trading volume surged to nearly $300 million at the peak before normalizing as selling pressure increased.

The token’s failure to hold above the key $0.18 resistance level points to weakening buyer conviction, further accelerating the decline.

What next for APE token?

Like most meme and NFT-related tokens, ApeCoin faces an uncertain near-term outlook, largely tied to cooling sentiment in the NFT market.

While spikes in NFT activity often support tokens like APE, the broader market’s lack of sustained momentum has limited upside.

ApeCoin Chart
ApeCoin price chart by TradingView

Analysts point to ongoing weakness in NFT fundamentals, with sales volumes and transaction activity failing to match the hype-driven price surges seen in recent weeks.

Data from platforms such as OpenSea and Blur indicate a decline in overall NFT sales over the past seven days, putting additional pressure on ecosystem tokens.

From a technical perspective, indicators suggest the possibility of further downside. The Relative Strength Index (RSI) has pulled back from overbought levels and is trending around 68. While not yet bearish, a move toward 50 or lower could open the door for a retest of the all-time low near $0.081.

On the upside, a recovery in sentiment could push APE toward the $0.20 and $0.30 levels, though that would likely require renewed strength in the broader NFT market.


The post ApeCoin price falls sharply as NFT sector momentum fades appeared first on CoinJournal.

XRP price forecast as tokenized RWA on XRP Ledger explodes to $3B

  • XRP is currently trading at $1.38, down over 3% in the past week.
  • The XRP Ledger has attracted over $3 billion in tokenized real-world assets.
  • XRP could retest $1.25 or lower if bearish pressure persists.

Ripple cryptocurrency XRP is trading largely flat over the past 24 hours, as buyers struggle to decisively breach the $1.40 level following an intraday uptick from lows of $1.36.

The price performance—showing XRP down on the weekly timeframe and up just 5% over the past month—contrasts with a sharp spike in the value of tokenized real-world assets (RWAs) on the XRP Ledger.

XRP Ledger hits $3 billion RWA value

While XRP continues to struggle for upside momentum, bullish sentiment appears to be building around the XRP Ledger (XRPL).

The network has reached a milestone of $3 billion in total tokenized real-world asset value, marking a notable 55% increase over the past 30 days.

According to data from rwa.xyz, XRPL’s growing RWA ecosystem now includes more than 290 active projects.

On-chain activity is also reflected in 3,819 unique RWA holders, while the stablecoin market capitalization on XRPL exceeds $508 million.

Among specific projects, the largest RWA on XRPL is Justtoken’s JMWH token, a tokenized commodities asset valued at over $1.76 billion.

Meanwhile, Ripple’s native RLUSD stablecoin accounts for more than $400 million in tokenized value, while Ondo Finance’s short-term US Treasury products and VERT Capital’s asset-backed credit contribute approximately $323 million and $139 million, respectively.

Market experts view XRPL’s RWA growth as a sign of increasing institutional adoption and confidence, with the potential to drive further network utility.

XRP price analysis

Despite the surge in RWA activity, XRP’s price remains capped below $1.50, as bulls face persistent pressure from macroeconomic headwinds and profit-taking.

The token has been in a broader downtrend since peaking at $3.67 in July 2025, with declines accelerating during major market sell-offs on October 10, 2025, and February 5, 2026, when prices dropped to lows of $1.58 and $1.13, respectively.

Recent weakness—including a pullback to $1.36—highlights the importance of the 50-day simple moving average as a key technical level.

From a chart perspective, XRP is trading within a descending triangle pattern on the daily timeframe.

The relative strength index (RSI) is hovering around 48 and trending lower, while a bearish MACD crossover reinforces near-term caution.

XRP Price Chart
XRP price chart by TradingView

Despite the cautious technical outlook, potential inflows from a future XRP ETF and improving macro or geopolitical conditions could lift broader crypto sentiment.

If RWA growth continues, strengthening on-chain metrics—such as rising holder counts and stablecoin total value locked—may provide additional support.

In the short term, XRP risks a move toward $1.25 if downside pressure persists.

However, a sustained break above $1.45 could open the door to $1.70. In a more bullish, RWA-driven scenario, $2.00 and the key $3.00 level emerge as major resistance zones.


The post XRP price forecast as tokenized RWA on XRP Ledger explodes to $3B appeared first on CoinJournal.

AAVE could reclaim $100 as focus shifts to rebuilding rsETH collateral

  • AAVE price consolidates as market awaits recovery clarity.
  • rsETH recovery plan addresses $246M bad debt from the Kelp DAO exploit.
  • The immediate resistance sits at $100 as governance execution drives the outlook.

AAVE token is currently priced at $97.13, down 0.3% over the past 24 hours, while the broader market has remained slightly positive.

That difference has kept AAVE in focus, not because of broad weakness, but because traders are waiting to see whether the proposed recovery plan designed to restore rsETH collateral after the Kelp DAO exploit can be executed cleanly.

The key question is whether the recovery effort can remove uncertainty fast enough to allow the token to reclaim the $100 mark and hold above it.

rsETH collateral recovery plan takes centre stage

The main driver behind AAVE’s current setup is the technical plan proposed to rebuild rsETH collateral after the exploit linked to Kelp DAO.

The exploit left about $246 million in bad debt across Aave and Compound, creating pressure for a coordinated solution rather than a simple market fix.

The proposed plan is designed to restore backing for rsETH and reduce the fallout without spreading the losses across users.

At the centre of the proposal is a governance-led process across Ethereum and Arbitrum.

The plan calls for temporary oracle adjustments and the liquidation of the attacker’s positions in a controlled way. That makes the recovery effort more structured, but also more dependent on execution.

Traders are now watching the proposal as a practical test of whether Aave Protocol can repair collateral damage without introducing more risk.

In the short term, that uncertainty has kept sentiment measured, even though the plan itself is aimed at stabilising the system.

AAVE price outlook

AAVE’s near-term outlook now depends heavily on how the recovery plan unfolds.

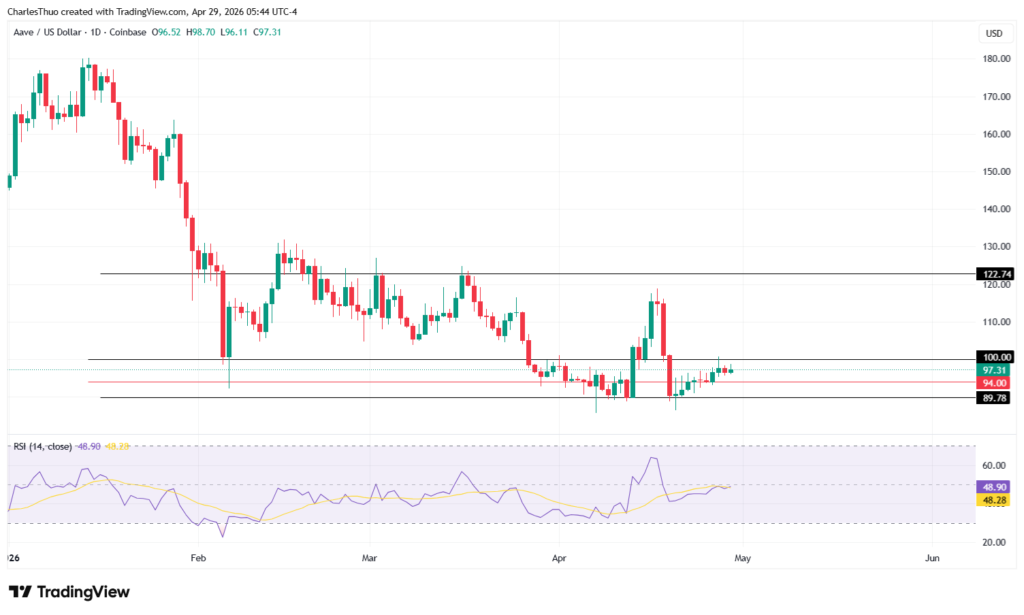
On a technical standpoint, the immediate support is near $96. The token has already spent time close to that area, and a failure to hold it could shift the market tone back toward caution.

A drop below $94 would be more concerning because it would suggest the market is no longer treating the recovery effort as a near-term stabilising force.

AAVE price analysis
AAVE price chart

The broader technical picture also shows that AAVE is consolidating rather than trending aggressively.

Its current level is close to the 30-day simple moving average of $96.95, which supports the idea that the market is waiting for confirmation before committing to a stronger directional move.

What matters next

Market participants will be looking for approval of the temporary changes needed to support the recovery, as well as signs that collateral restoration is progressing without delays.

If those milestones are reached, AAVE could gain enough confidence to challenge the $100 level again.

Trading volume also shows that the market is engaged but not yet convinced.

The latest 24-hour volume of $254.39 million reflects active participation, but not a broad rush into the token. That usually means the market is waiting for a clearer signal before taking stronger positions.

The post AAVE could reclaim $100 as focus shifts to rebuilding rsETH collateral appeared first on CoinJournal.

Pi Network price outlook amid Protocol 22 upgrade, ahead of the May Protocol 23 upgrade

  • Protocol 22 has boosted the scalability of Pi Network ahead of smart contracts in May.
  • Pi must break $0.190 to target $0.2045 and $0.220.
  • Key support at $0.1832 remains crucial for bullish momentum.

Pi Network (PI) token traded near $0.1893 on April 28 after gaining roughly 5.8% in 24 hours and more than 10% over the past week, reflecting stronger market interest as the network moves through a critical development phase.

The recent recovery is notable considering the asset’s all-time low of $0.1312 in February 2026, while still sitting far below its February 2025 peak of $2.99.

Protocol 22 mainnet upgrade

Notably, the price surge comes as Pi Network completed its Protocol 22 mainnet upgrade on April 27, a major infrastructure update designed to improve scalability, transaction throughput, and overall network readiness for decentralised applications.

Protocol 22 is widely seen as a foundational step before the expected Protocol 23 rollout in May, which is projected to introduce smart contracts and expand Pi Network’s ecosystem with broader decentralised finance (DeFi) and cross-chain functionality.

More than 10 billion PI tokens have already migrated to Mainnet, with approximately 6 billion remaining locked.

This large locked supply continues to limit immediate sell pressure while also supporting market attention around future utility expansion.

For many traders, the upcoming Protocol 23 release is even more important since smart contract functionality could significantly expand PI’s practical use cases beyond peer-to-peer transfers by allowing developers to build decentralised applications directly on the network.

Technical indicators show improving momentum

Current technical analysis suggests Pi is attempting to form a double-bottom breakout pattern, with the neckline sitting near $0.190.

A confirmed move above this level could push the price toward $0.2045, while a stronger continuation may open the path toward $0.220.

According to aggregated market indicators, a majority of technical indicators signal that the short-term momentum is leaning positive.

Moving averages are especially supportive, with PI currently above its 10-day, 20-day, 50-day, and 100-day exponential moving averages, reinforcing short-term strength.

However, the token still trades below its 200-day EMA, which suggests broader macro resistance remains in place.

The 14-day Relative Strength Index stands at 63.96, placing PI coin in neutral territory without signalling immediate overbought conditions.

On the weekly timeframe, RSI is closer to 36.01, which indicates that PI may still be recovering from previously oversold conditions.

Pi Network price analysis

Pi Network price forecast

Looking at the price targets that traders should consider moving forward, the immediate support sits at $0.1832.

A drop below this level may weaken short-term bullish momentum and expose Pi Network (PI) to downside pressure toward $0.1670, with deeper losses potentially reaching $0.1322.

On the upside, the first major resistance is $0.1884. A breakout above this level would strengthen breakout potential and could send PI coin toward $0.1926.

If bulls successfully clear the broader $0.190 neckline, the next major target becomes $0.2045. A sustained breakout above that level may extend gains toward $0.220.

Looking further ahead, broader 2026 projections place PI’s possible trading range between $0.1121 and $0.5246, depending largely on successful ecosystem expansion, smart contract adoption, and broader crypto market conditions.

The post Pi Network price outlook amid Protocol 22 upgrade, ahead of the May Protocol 23 upgrade appeared first on CoinJournal.

PENGU token jumps 14% amid Pudgy Penguins floor price pump

  • Pudgy Penguins (PENGU) price touched $0.010 amid double-digit gains.
  • The token surged as the Pudgy Penguins floor price pumped.
  • Other non-fungible tokens also soared, including the Bored Ape Yacht Club.

Pudgy Penguins’ native PENGU token is up double digits in the past 24 hours, riding high on skyrocketing floor prices to touch three-month highs.

This surge comes amid notable price increases in the Pudgy Penguins NFT, with other tokens related to the sector also experiencing significant gains.

However, an uptick for Bitcoin and Ethereum fizzled on Monday, a scenario that puts the tokens’ prices in danger of retreating amid profit-taking.

Pudgy Penguins soars 14% amid NFT price gains

Data shows top non-fungible token collections are experiencing a remarkable resurgence, with floor prices extending their upside momentum.

Pudgy Penguins currently leads the charge as its floor price climbs above 5 ETH, with over 20% in weekly gains.

Market data highlights this momentum, with over 20 sales and nearly 1,000 ETH in trading volume over the past seven days.

The Bored Ape Yacht Club (BAYC) NFT boosts similar metrics and shows an 81% spike in floor price over the last 30 days.

Yet, this optimism contrasts with contracting overall NFT market participation.

Global sales, transactions, and active users have nearly halved since February, even as average sale prices have more than doubled.

This divergence suggests a concentration of capital among high-value collections like Pudgy Penguins, potentially signaling selective bullishness rather than broad recovery.

Notably, PENGU price is up 40% over the past week, and the 14% gain in the last 24 hours has pushed it to above $0.010 for the first time since late January.

Pudgy Penguins is in double digits up year-to-date.

​Pudgy Penguins price analysis

Analysts attribute the NFT rally primarily to surging cryptocurrency prices, with Bitcoin (BTC) recently touching $80,000 and Ethereum (ETH) reaching $2,400.

The broader market sentiment looks to have amplified demand for top-tier NFTs, where Pudgy Penguins has stood out with elevated transaction counts accompanying its price climb.

In the market, surging floor prices typically reflect strong conviction, and the opposite shows amid declining floor prices.

PENGU gains mirror Pudgy Penguins’ NFT momentum, and the upmove lifts bulls above the $0.008 supply zone.

The surge to above $0.010 makes the 100-day and 50-day moving averages key support levels at $0.0082 and $0.007.

Pudgy Penguins PENGU Chart
Pudgy Penguins price chart by TradingView

Among technical indicators to note is the Relative Strength Index (RSI) that currently hovers above 70, signalling overbought conditions.

Traders may need to watch out for NFT market fatigue or a significant BTC pullback.

If this happens, PENGU price could test lower support levels, including Feb 6 low of $0.0052.

On the flipside, the moving averages hint at a potential golden cross, with price likely to extend towards the YTD peak around $0.014.

The post PENGU token jumps 14% amid Pudgy Penguins floor price pump appeared first on CoinJournal.