Decentraland rallies nearly 70% from January lows – But some indicators suggest a pullback is feasible

There are some signs right now that perhaps Decentraland (MANA) may be coming out of its bear market trend. The coin has rallied for the last 8 days in a row, making it one of the top-performing cryptos. But despite this bullish upside, some indicators suggest that a pullback is very possible. Here are some highlights though:

  • The recent bullish surge has seen MANA rally by a whopping 70% compared to January lows

  • At press time, the coin was trading at $2.65 with the $3 mark looking quite possible.

  • Despite this, some indicators suggest that we may see some pullback in the price action in the coming days.

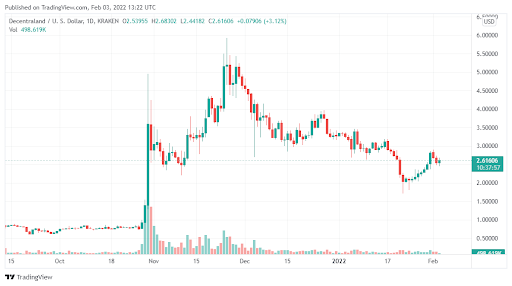
Data Source: Tradingview.com 

Decentraland (MANA) – Analysis and price prediction

After hitting monthly lows in January 22, it seems like Decentraland (MANA) has simply decided to fly. The coin is up nearly 70% from that period and has surged past a crucial resistance zone of $2.5. 

At the time of writing, the coin was trading at $2.65, holding off any selling pressure that we have seen in the past at the $2.5 mark. There are some analysts who in fact see the token heading well above $3. 

But despite this, we have seen a hidden bearish divergence between the composite index and the candlestick chart. This could suggest that a pullback for MANA is possible and may happen over the coming days.

Are metaverse tokens ideal investments?

Decentraland (MANA) is one of the main metaverse tokens in the world right now. During the January crypto winter, these tokens were hard hit. But the recent surge in MANA shows that investor appetite for the metaverse remains strong. We don’t expect this to change in the future, so in the long run, metaverse tokens like these ones are going to deliver immense value for investors.

The post Decentraland rallies nearly 70% from January lows – But some indicators suggest a pullback is feasible appeared first on Coin Journal.

This metric shows Bitcoin is at its ‘4th most oversold’ level in history,’ says analyst

The entity-adjusted dormancy flow has historically been used to mark potential price bottoms in the Bitcoin market.

Bitcoin continues to struggle with sell-off pressure since its dip below $40,000, with a recent bounce fading off near $39k and then Thursday’s downturn pushing it below $37k once again.

Will Clemente, a popular analyst who hosts the Bitcoin Intelligence podcast and writes a newsletter to over 70,000 investors, believes the current price levels put BTC in a position of a potentially huge bounceback move.

According to the analyst, the benchmark digital asset is trading at its fourth most oversold level in history.

And what metric does he look to as an indicator of a possible bullish reversal? He points to Bitcoin’s entity-adjusted dormancy flow.

„Bitcoin is currently the 4th most oversold in its history according to dormancy flow. Dollar-cost averaging more heavily into this area is probably the best approach for the long-term investor,“ he tweeted.

What’s entity-adjusted dormancy flow?

The dormancy flow basically relates to a measure of whether it’s old coins or new coins that are being moved on-chain every other day. High figures indicate its old coins moving while low figures suggest it’s mostly new coins.

To get the entity-adjusted dormancy flow, the coin destroyed value (dormancy flow) is divided by the market capitalisation.

BTC bottoming

According to the chart, dormancy flow has fallen significantly since the November peak as has the entity adjusted values. Currently, the indicator is below 200,000, with values this low having only been recorded on three other occasions- 2011, 2015, and 2019.

Historically, the market has rallied after the entity adjusted dormancy values fell below 250,000, the latest being in March 2020 and January 2022.

Bitcoin rallied to new highs in each of the previous cases and a similar trajectory would mean the bottom is in around current price ranges. 

The post This metric shows Bitcoin is at its ‘4th most oversold’ level in history,’ says analyst appeared first on Coin Journal.

Lohnen sich SOL, ADA und ETH am 3. Februar 2022?

  • Solana (SOL), Cardano (ADA) und Ethereum (ETH) sind allesamt Blockchain-Netzwerke, die über Smart Contracts verfügen und die Blockchain-Skalierung angehen.

  • Jedes Projekt zielt darauf ab, Skalierungsprobleme zu lösen und sein dApp-Ökosystem zu verbessern.

  • Alle diese Token haben Wachstumspotenzial.

Solana (SOL), Cardano (ADA) und Ethereum (ETH) sind alles solide Blockchain-Projekte, die in Bezug auf die Funktionalität miteinander konkurrieren.

Wir werden prüfen, ob es sich lohnt, jeden Token am 3. Februar 2022 zu kaufen.

Sollten Sie Solana (SOL) kaufen?

Am 3. Februar 2022 hatte Solana (SOL) einen Wert von 94,89 USD.

Der Allzeithochwert des Solana (SOL)-Tokens war am 6. November 2021, als der Token einen Wert von 259,96 USD erreichte.

Das bedeutet, dass der SOL-Token bei seinem ATH-Wert um 165,07 USD oder um 173 % höher war als heute.

In Bezug auf die Performance im Januar erlebte Solana (SOL) am 2. Januar seinen höchsten Wertpunkt, als es einen Wert von 178,74 USD erreichte.

Sein Tiefpunkt war jedoch am 24. Januar, als der Wert auf 82,5 USD fiel.

Das bedeutet, dass der Token um 96,24 USD oder 53 % an Wert verloren hat.

Vom 24. Januar bis zum 3. Februar verzeichnete der SOL-Token jedoch einen Wertzuwachs von 12,39 USD oder 15 %.

Vor diesem Hintergrund ist SOL ein solider Kauf, da es bis Ende März 2022 110 USD erreichen kann.

Sollten Sie Cardano (ADA) kaufen?

Am 3. Februar 2022 hatte Cardano (ADA) einen Wert von 1,0215 USD.

Der Allzeithochwert des Cardano (ADA)-Tokens war am 2. September 2021, als der Token einen Wert von 3,09 USD erreichte. Dementsprechend war der Wert des Tokens an seinem ATH-Punkt um 2,0685 USD oder um 202 % höher als heute.

In Bezug auf die Performance im Januar sah Cardano (ADA) seinen höchsten Wert am 18. Januar, als es einen Wert von 1,6245 USD erreichte.

Sein niedrigster Wert war jedoch am 24. Januar, als der Wert des Tokens auf 0,9668 USD fiel.

Dies ist ein Wertverlust von 0,6577 USD oder 40 %.

Vom 24. Januar bis zum 3. Februar stieg der Wert des ADA-Tokens jedoch um 0,0547 USD oder um 5 %.

Vor diesem Hintergrund kann ADA bis Ende März 2022 1,5 USD erreichen, was es zu einem soliden Kaufobjekt macht.

Sollten Sie Ethereum (ETH) kaufen?

Am 3. Februar 2022 hatte Ethereum (ETH) einen Wert von 2.595,76 USD.

Der Allzeithochwert des Ethereum (ETH)-Tokens war am 10. November 2021, als der Token einen Wert von 4.878,26 USD erreichte. Das bedeutet, dass der Wert des Tokens bei seinem ATH um 2.282,5 USD oder um 88 % höher war als heute.

In Bezug auf die Performance im Januar war der höchste Wert von Ethereum am 4. Januar, als der Wert des Tokens auf 3.874,34 USD stieg.

Sein niedrigster Wert war jedoch am 24. Januar, als der Token auf 2.199,92 USD fiel. Dies bedeutete einen Wertverlust von 1.674,42 USD oder 43 %.

Vom 24. Januar bis zum 3. Februar stieg der Wert von ETH jedoch um 395,84 USD oder um 18 %.

Vor diesem Hintergrund kann ETH bis Ende März 2022 2.750 USD erreichen, was es zu einem soliden Kauf macht.

The post Lohnen sich SOL, ADA und ETH am 3. Februar 2022? appeared first on BitcoinMag.de.