Litecoin’s bullish trend gathers momentum after the Mimblewimble upgrade.

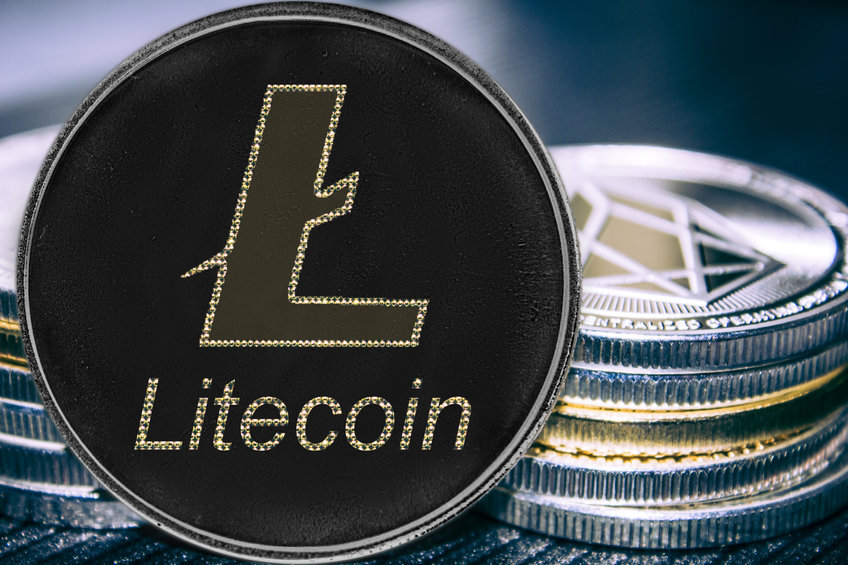
Litecoin has started the month with a surge. The token has jumped and it is still green.

At the time of writing, it was up 5.44% according to the CoinMarketCap. It hit a high of $111.45 and a low of $105.02 in the last 24 hours.

But why is the LTC coin rallying? Let’s take a deep dive to examine what is behind the current LTC price hike.

What is Litecoin?

Before we delve into the current Litecoin bullish trend, it is important to familiarise ourselves with the Mimblewimble upgrade and Litecoin blockchain.

Litecoin is a blockchain designed to provide secure, fast, and low-cost payments using blockchain technology. LTC is its native token.

Mimblewimble upgrade introduces a unique security framework that aims at ensuring that the transaction done through the Litecoin network are secure.

Why is Litecoin (LTC) price rallying?

Litecoin has seen a bullish momentum after the long-awaited Mimblewimble upgrade was completed. Litecoin platform has been under development for two years and it shall go to a great length of providing a high privacy-focused transaction to the network.

The upgrade through the Mimblewimble Extension Block (MWEB). It aims at helping users do their transactions confidently. After the upgrade, the network has renewed its on-chain strength.

The current price boost of Litecoin has been mainly contributed by the upgrade that together with the macro factors has triggered the selling pressure and will remain mitigated in February. The massive bullish trend is expected to continue.

The recent upgrade stands to be among the most hyped integration for Litecoin to its community.

After getting the integration code, the Litecoin community and miners can start signing in for Mimblewimble. The activation date for the proposal will then be determined once the limits are concluded.

The post Litecoin’s bullish trend gathers momentum after the Mimblewimble upgrade. appeared first on Coin Journal.

India to impose 30% tax on crypto income, CBDC in 2022-2023

The 30% tax is the highest income tax bracket in India

India will also launch its digital rupee in the financial year 2022-2023, the Finance Minister said.

India will begin levying a 30% tax on all income from cryptocurrency transfers, according to the country’s Finance Minister Nirmala Sitharaman.

In a budget speech delivered on Monday, the minister noted that the 2022-23 financial year will see authorities seek to bring all digital assets transfers and income, including non-fungible tokens (NFTs) under the tax umbrella.

Apart from the 30% levy on gains, India will also have a 1% tax the government official said will be deducted at source (TDS). This levy will apply to payments or fees paid in relation to the transfer of cryptocurrencies, Sitharaman added.

Gifts made in crypto will also be taxed, according to the ministers’ tax proposals, with the taxman targeting recipients of crypto gifts.

According to the Finance chief, losses incurred on cryptocurrency investments will not be offset with gains made elsewhere.

The crypto capital gains tax and other levies appear to show the government has finally recognised crypto in India. It signals a marked shift from the previous calls for a blanket ban, with Changpeng Zhao, the CEO of the world’s largest cryptocurrency exchange by trade volume Binance, among those to point out the likelihood of this development.

The 30% tax rate is double that of 15% levied on short capital gains for stocks. However, the crypto community has been quick to point out that India’s proposal falls in one of the tax brackets into which most crypto holders already fall.

Digital Rupee in 2022-2023

India is also ready to roll out a central bank digital currency, the Finance Minister said during the budget speech. According to her, the digital rupee will launch in the 2022-2023 financial year.

„Introduction of a central bank digital currency will give a big boost to digital economy. Digital currency will also lead to a more efficient and cheaper currency management system,“ she told lawmakers.

The tax proposals and move towards a CBDC come after months of speculation on what path the country was taking as it looks to regulate the burgeoning crypto industry.

The post India to impose 30% tax on crypto income, CBDC in 2022-2023 appeared first on Coin Journal.

You can now buy CHEDDA, the biggest winner of the day: here’s where

CHEDDA is a decentralized culture token created on the Ethereum blockchain as an ERC20 token. It began to surge on news of an upcoming listing on ZTexchange and has gained 66% just today.

If you want to know more about CHEDDA, including whether it’s worth investing in and the best places to buy CHEDDA, you’ve come to the right place.  

Top places to buy CHEDDA now

As CHEDDA is such a new asset, it’s yet to be listed on major exchanges. You can still purchase CHEDDA using a DEX (decentralised exchange) though, which just means there are a few extra steps. To buy CHEDDA right now, follow these steps:

1. Buy ETH on a regulated exchange or broker, like eToro ›

We suggest eToro because it’s one of the world’s leading multi-asset trading platforms, an exchange and wallet all-in-one with some of the lowest fees in the industry. It’s also beginner-friendly, and has more payment methods available to users than any other available service.

2. Send your ETH to a compatible wallet like Trust Wallet or MetaMask

You’ll need to create your wallet, grab your address, and send your coins there.

3. Connect your wallet to the Uniswap DEX

Head to Uniswap, and ‚connect‘ your wallet to it.

4. You can now swap your ETH for CHEDDA

Now that you’re connected, you’ll be able to swap for 100s of coins including CHEDDA.

What is CHEDDA?

The ERC20 token has a 3% fee on every transaction. 1% is burned forever and the other 2% is distributed to the CHEDDA team for continual development of the project. Burning tokens on every transaction makes CHEDDA a deflationary asset.

There will never be as many CHEDDA in circulation as there is now. By burning half the supply and 1% of every transaction, the total supply of CHEDDA will decrease over time.

This gives holders an incentive to hold their tokens long-term as the circulating supply lowers and the price of the token increases.

Should I buy CHEDDA today?

CHEDDA is performing very well at the moment, but do market research and observe trends before committing to an investment. Take all advice with a grain of salt.  

CHEDDA price prediction

CHEDDA has outperformed price predictions by Digital Coin Price, Coin Data Flow, and many other analysts. Generally, a price of $0.002 was predicted a year from now. CHEDDA is currently trading for three times that.   

CHEDDA on social media

The post You can now buy CHEDDA, the biggest winner of the day: here’s where appeared first on Coin Journal.

Cosmos tries to find support at $26 after a 45% drop in two weeks

  • Cosmos dropped 45% over the last two weeks. 

  • Price found support at the $26 mark. 

Cosmos (ATOM/USD) is a project meant to solve the main challenges facing blockchain technology. It aims to eliminate the negative consequences of using blockchains such as environmental degradation, high cost of power, and increased processing time of transactions and data transfer. 

On January 17th, 2022, Cosmos traded at the $44.4 mark and was one of the best-performing crypto assets for 2021. As 2021 started, Cosmos was trading at $4-$5 and reached a high of $44 before the year ended. This was more than a 1,000% return. 

Out of that outstanding gains for 2021, markets have wiped out more than 45% of the value of this coin in less than two weeks. 

Source – TradingView

Using pivot points analysis, it is clear that markets today opened around the support level S1 ($26), which is far outside the equilibrium level P ($30.5), where market participants believe is the fair price for the week. On such openings, the price will quickly trade back to equilibrium price before the main trend for the week takes over. Cosmos price is also trading above 9 and 21 days moving average, signaling heavy bullish pressure in the market. 

The current market price is $28.270, and the weekly central pivot also offers some strong support to price, allowing bills to survive the bearish wrath from the last two weeks. 

Where next for this coin? 

If the price can float above $26 support, we might see some bullish pressure come into the market in the medium term to push the price to equilibrium for the week at the $30-$31 mark. However, most markets are still uncertain about the long-term direction. The general market is concentrated with interest rates risks from major central banks which may shift how financial markets have worked over the past three years.

The post Cosmos tries to find support at $26 after a 45% drop in two weeks appeared first on Coin Journal.

Waves (WAVES/USD) is down 81% from all-time highs ($42.7), currently trading at $9.13

  • The price of WAVES has been spiraling down without a halt.

  • WAVES is seeing slight resistance at $10.3.

  • WAVES/USD is currently trading at $9.13. 

Source – TradingView

The Waves pricing shows a strong bearish trend, with bears dominating the price charts for the majority of the months since October. After being rejected at $10.3 on January 27th, the price levels have sharply plummeted, and the coin value has dropped to the $9 zone. The collapse had an effect, and the bearish trend has persisted today.

WAVES/USD one-day price chart: bulls advanced to $12.8 resistance level

Over the weekend Waves price evaluation indicated a negative trend, and the price has dropped to $8.55 today. The previous week’s price chart was characterized by red candlesticks, indicating that bears were continually pushing the price to fall; however, bulls also made strong gains on January 26th, taking the price point to $12.8. Since then, bears have been impeding upward price trends, but today, the bears have gained a little profit as the price is currently locked in the $9.15region.

The MA is trading at $9.55, barely under the price point, while also remaining below the SMA50 curve, indicating a negative trend. Conversely, if we look at the 9 days Simple Moving Average signals, the resistance is at $16, indicating the highest volume pressure is at that level.

The four-hour Waves pricing assessment reveals that the bulls dominated the price component for most of today’s trading period, but bears triggered a sharp price drop today, following a continuous bullish lead. Despite the negative momentum being low, it has outperformed the bullish momentum and made the daily candlestick bearish. Yet, the value has been seen to be rising during the previous eight hours.

The post Waves (WAVES/USD) is down 81% from all-time highs ($42.7), currently trading at $9.13 appeared first on Coin Journal.