Chainlink extend negative price action to the south as price trade below $17.75 resistance

Supply and demand have been termed as the major factor that causes uphill and downhill in the market. However, in a bearish moment such as this period, it’ll be best to have a firsthand approach to the market.

While it’s easier to open a buy or sell order on the flip side, the consequence of inadequate understanding of the market price movement may result in total loss of trading account. And to be able to stay ahead of the market do read below to get a grasp of what Chainlink (LINK) has to offer this week.

LINK/USD technical analysis outlook

Source – TradingView

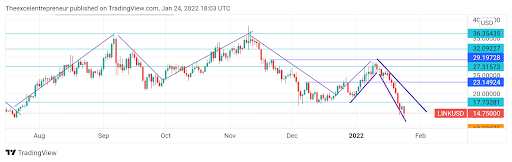
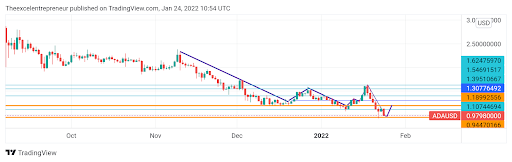
Across the hourly chart, the price action of Chainlink had broken below the $17.73 resistance after strong bearish market volatility pushed the price of the assets into a negative sell-off mode.

However, at the time of writing this analysis, the value of LINK/USD tends to trade along the July 23rd market initial support region. In essence, if the price should plunge below this level, the entire price movement of LINK/USD will meet near-term support at a $10.59 bearish price target.

Weekly price chart

Source – TradingView

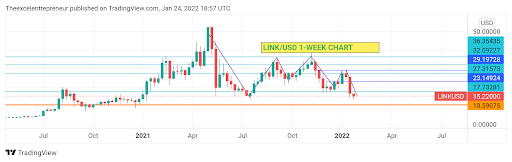
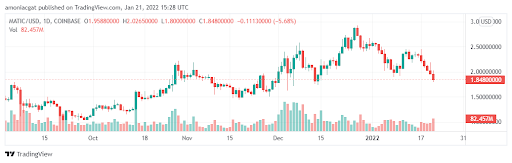
After facing rejection along with $27.31 resistance, the value of LINK/USD tends to plummet aggressively against the US dollar as fundamental economic updates from the US region aim to hasten the action of sellers at driving the price of the asset to the South. However, the overall price action of Chainlink across all time frames remains negative.

Where could be a positive turning point for the asset

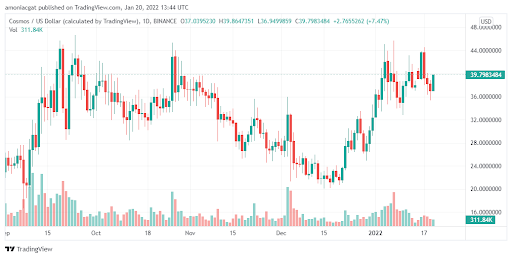
While awaiting the market to complete its bearish price movement, we should however be aware that if this negative price action should extend further, the value of LINK/USD may likely find a resting point at $10.59 If at all the volume of the sellers outweigh the buyers‘ momentum.

The post Chainlink extend negative price action to the south as price trade below $17.75 resistance appeared first on Coin Journal.

Cardano extends negative price action to $0.94 after market supply outweigh demand

  • Strong bearish pressure pushed the price of Cardano to the south
  • $0.94 is the next bearish target for the asset
  • Cardano relation with Ethereum ( the essential things to know between the two assets)

According to Nerd wallet, Cardano (ADA) has been termed as a fast-rising digital currency network that should be considered as the next opposition to the Ethereum network. Despite the presence of bearish market situations across the entire crypto market, Cardano’s total market Cap as of the time of writing this analysis is worth $33 billion and $14 billion below the USD stable coin.

Technical outlook for ADA/USD Price Action

Cardano sight a fresh support at $0.94

At the moment, the all-round price action of Cardano remains negative as the value of the asset aims to hit a negative price target at $0.94, and if at all the market supply should outperform the demand for the asset, the value of Cardano will retain negative value.

ADA/USD hourly technical analysis viewpoint

Source – TradingView

From the hourly chart market, speculators would see that Cardano has for long been trading with a strong bearish price action after facing tight rejection along with the $1.39 near-term resistance.

However, if at all the price of action of the digital asset pair should break below the immediate support at $0.94 then the overall price action of Cardano will resume to the bearish zone. On the flip side, if the price movement of Cardano should bounce above the $0.94 immediate support, the value of ADA/USD will tend to hit immediate resistance at $1.10.

Cardano daily technical analysis

Source – TradingView

From the 1-day chart, Cardano Seems to trade with a strong bearish bias after making a series of lower lows into support in the previous trading bout. Yet $0.94 could be a turning point for the asset if the volume of the buyers should outweigh the sellers‘ pressure in the market.

Summary

Cardano trades with a strong bearish bias, as the value of the asset eyes to retest the previous negative price target of $0.94.

The post Cardano extends negative price action to $0.94 after market supply outweigh demand appeared first on Coin Journal.

Polygon’s (MATIC) bloodbath continues as altcoin declines past crucial support- Price prediction and analysis

Polygon (MATIC) has been seeing a massive sell-off over the last few days. Although the general trend for the altcoin is still positive, MATIC has declined sharply and is past a very crucial support zone that could make losses even worse. But is there any hope of a possible rebound? Here are some highlights:

  • At the time of writing, MATIC was trading at around $1.83, nearly 15% down in intraday trading.

  • The altcoin had in fact tumbled below $1.7, a crucial support level, albeit it managed to regain those losses.

  • MATIC has also slid past its 200-day moving average, suggesting a rout is coming.

Data Source: Tradingview.com 

Polygon (MATIC) – Price action and analysis

Polygon (MATIC) was by far one of the top-performing altcoins in 2021. But after a dip in crypto this year, it has followed other coins in decline. At the time of writing, the coin had lost nearly 15% of its value in less than 24 hours. 

This came as a huge shock considering MATIC was actually on an uptrend, has reversed some of the losses seen at the start of the year. More seriously, the coin has also surged below its 200-day moving average, suggesting that a bearish trend could hold. 

If indeed MATIC is not able to break past $1.75 and sustain gains there, then it could head towards $1 in the near term.

Should you buy Polygon (MATIC)

The answer is yes. If you are keen on buying quality cryptos with some amazing underlying fundamentals, then you won’t find a better option than MATIC. In fact, this recent dip gives investors a good opportunity to grab it at a discount. It is highly likely that the altcoin will rebound and head back up. As for short-term plays, MATIC is just too risky.

The post Polygon’s (MATIC) bloodbath continues as altcoin declines past crucial support- Price prediction and analysis appeared first on Coin Journal.

Cosmos (ATOM) remains resilient during the crypto slump – Should you buy it?

Cosmos (ATOM) has shown some incredible resilience even as the broader crypto market reported weakness in January. The coin in fact has traded very close to its all-time highs albeit is it is a bit lower. With this price action, should you buy Cosmos (ATOM)? Here are some highlights first:

  • At the time of writing, the token was trading at $39.41, fairly close to its all-time high price of around $46.

  • Also, Cosmos (ATOM) is about 400% up from its lowest price, recorded in June last year.

  • The coin has also surged by nearly 7% in 24-hour intraday trading.

Data Source: Tradingview.com 

Cosmos (ATOM) – price prediction and analysis

For the most part of January, a lot of Altcoins in the market has seen massive routs. But it seems Cosmos (ATOM) has managed to hold steady. Despite taking a few hits, the token has rebounded. It is still about 3% down in 7 days but remains 7% higher in 24-hour intraday trading. 

At the time of writing this post, Cosmos (ATOM) was trading at around $39. It is quite close to its all-time high of $46. Although we don’t expect it to retest those heights in the coming days, Cosmos (ATOM) is likely to consolidate around the $40 mark. Also, the token has surged past its 25- and 50-day moving averages, suggesting that a bullish alignment is well and truly in the mix.

Should you buy Cosmos (ATOM)

Cosmos (ATOM) is one of the most popular altcoins. The chain also looks to offer one of the fastest and low-cost blockchains in the world for innovative developers. It has been a hit among investors, ranking among the top 10 by market cap.

Based on those fundamentals, it is a decent token to get your hands on. The recent price action also shows it can be resilient even if broader headwinds hold back crypto assets.

The post Cosmos (ATOM) remains resilient during the crypto slump – Should you buy it? appeared first on Coin Journal.

Baby DogeCoin (BabyDoge) gets 1.3 million holders – should you buy it?

2022 has seen the entrance of a new dog-themed meme token, the Baby DogeCoin (BabyDoge)The meme coin is now gaining superb momentum and a fanatical following of investors who see it reaching the same heights as other meme coins like Shiba Inu and Dogecoin. But should you buy it? Well, here are some highlights first:

  • At the time of writing, Baby DogeCoin (BabyDoge) in fact had attracted over 1.3 million holders

  • The coin has also surged to a market cap of around $1.6 billion, trading at $0.000000006015 per coin.

  • Baby Dodge is also up around 10% in the last 24 hours, indicating increased bullish activity.

Data Source: Coinmarketcap.com 

Baby DogeCoin (BabyDoge) – Price action and analysis

Shortly after launching this year, Baby DogeCoin (BabyDoge) has attracted a fair share of fans. The coin now has about 1.3 million holders, with whales getting into the action as well. The token has also been getting listings from top exchanges, including CoinEx and others. 

This has pushed the coin higher, gaining nearly 10% in the last 24 hours. We have also seen increased social media buzz for Baby DogeCoin (BabyDoge). In fact, the token has been one of the trending topics on Twitter, and its official account already has over 800,000 followers. At the time of writing this post, Baby DogeCoin (BabyDoge) was trading at $0.000000006015.

Should you buy Baby Doge?

The hope for most people who have invested in BabyDoge is to see it rival other meme coins like Shiba Inu, Dogecoin, and others. This is very possible and could help you make massive returns. In fact, BabyDoge went from zero to $1.6 billion in market cap quite fast.

But please note that meme coins don’t have any serious underlying fundamentals. They are simply speculative assets and as such, they are very risky. Do not put all your life savings here.

The post Baby DogeCoin (BabyDoge) gets 1.3 million holders – should you buy it? appeared first on Coin Journal.