Bitcoin bottom not in yet, according to on-chain analysis

On-chain analysis is fascinating to me. Exclusive to the blockchain, it doesn’t exist outside of crypto. But in jumping on-chain, we can often get intriguing insights into market sentiment, and specific indicators have even been predictive of future price action.  

Of course, given Bitcoin’s short history of just over a decade, it’s not yet clear which indicators are merely coincidences and which carry actual value. But that’s part of the fun, no?

Percentage of Supply in Profit

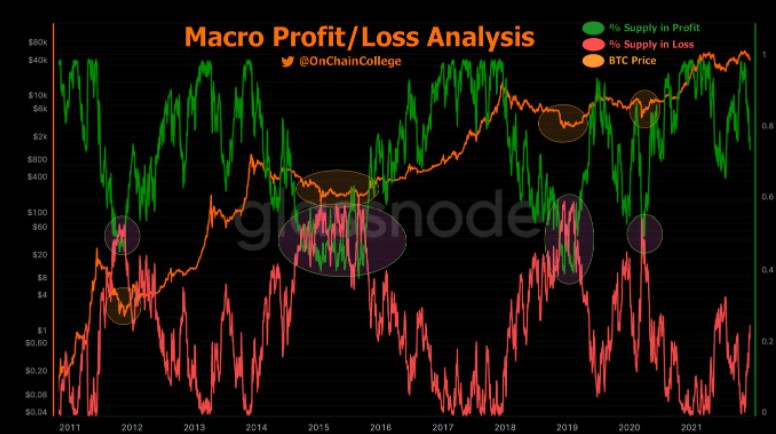
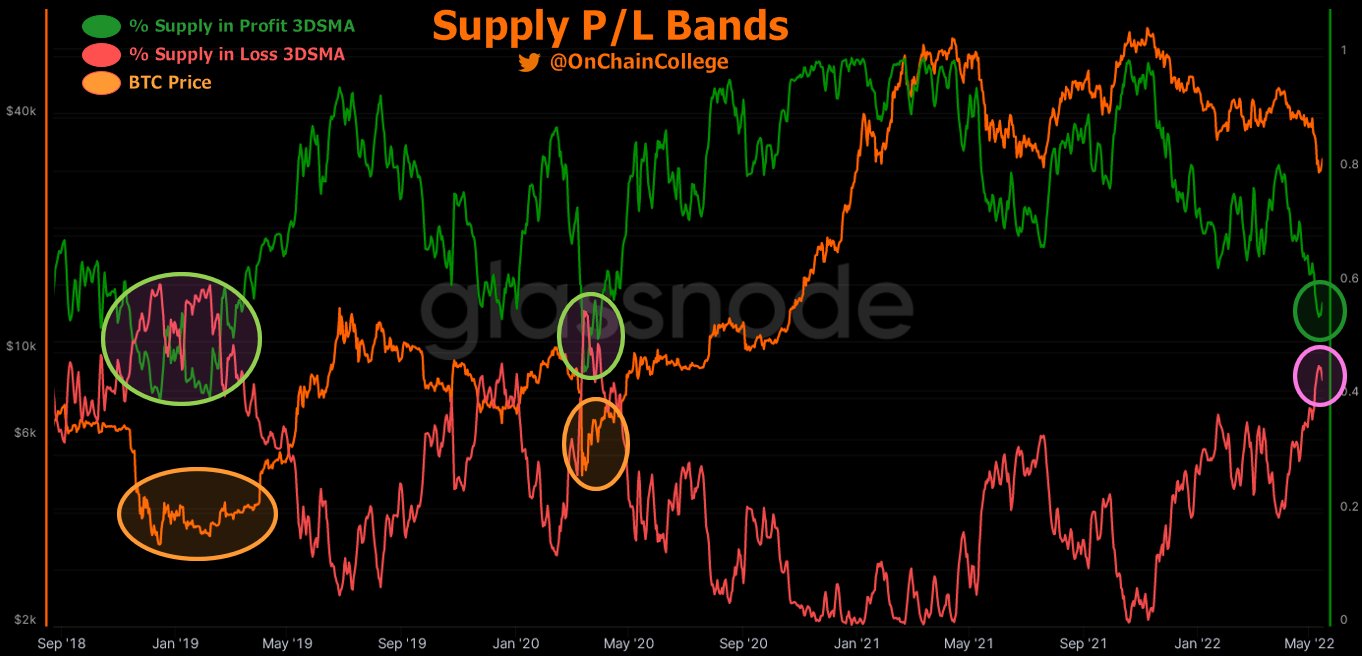
I came across an exciting indicator this week on Twitter, compiled by @OnChainCollege, who is a great follow if you’re into on-chain analysis. He looks at the percentage of Bitcoin supply in profit to gauge how overheated (or cooled off) the market is. Historically, this has signalled the start and end of the bear markets quite well for Bitcoin.

And these bands are very close to crossing at the moment.

To explain what the metric is, for those unaware, the percentage of supply in profit refers to the percentage of existing bitcoins where the current price is higher than the price at which those bitcoins were purchased. When the percentage of supply in profit rises above 50%, this is a top signal. When the percentage drops below 50%, this is a bottom signal. Or so the theory goes.

The graph below shows this, going back to 2011. Note that @OnChainCollege graphed it by placing the percentage of supply in loss (red) on the chart too, as well as the percentage of supply in profit (green). These two lines crossing would be the indicator.
Historical Accuracy

As you can see, this has crossed only four times previously. The most recent was March 2020, when the onset of COVID rattled the markets. In my view, this was the scariest time in crypto history – a true existential event (to be honest, it felt like it was an existential crisis for the world as a whole).

To play devil’s advocate, you could probably write this instance off as a black swan event, and overlook the impressive bounce that followed the crossover here – fine. But in looking at the other cases, the prediction ability holds in all three cases: 2019, 2014 and 2011.  

That’s all well and good. But what is the market saying now? Well, the percentage of supply in loss has not crossed the percentage in profit – yet. If the pattern holds, that means there may still be more pain to give before the bottom is in.
Caveats to On-Chain Analysis

Obviously, any on-chain analysis comes with the caveat that not only is the sample space small, but the data may be non-structural, with material changes to the landscape. Today, we are seeing rampant inflation, a hawkish Fed and a scary geopolitical climate. This has triggered the worst start to a year for stocks since 1939.

These macro headwinds mean that, for the first time in Bitcoin’s history, it is swimming upstream against serious and consistent bearish sentiment – April was the worst month for stocks since October 2008. Additionally, Bitcoin has almost nothing in common today with the niche Internet money it was back in 2011, or even 2014. Today, it takes its place amid bonafide asset classes, with institutional money pouring in and a seat at the macro table.

All this means that there is far from a guarantee that history repeats itself here, should these bands cross again. Nonetheless, it’s a fascinating trend to keep an eye on and a neat use of on-chain analysis from an analyst who is a personal favourite of mine. It will be fun to track going forward.

The post Bitcoin bottom not in yet, according to on-chain analysis appeared first on Coin Journal.

Tron price prediction: USDD concerns remain

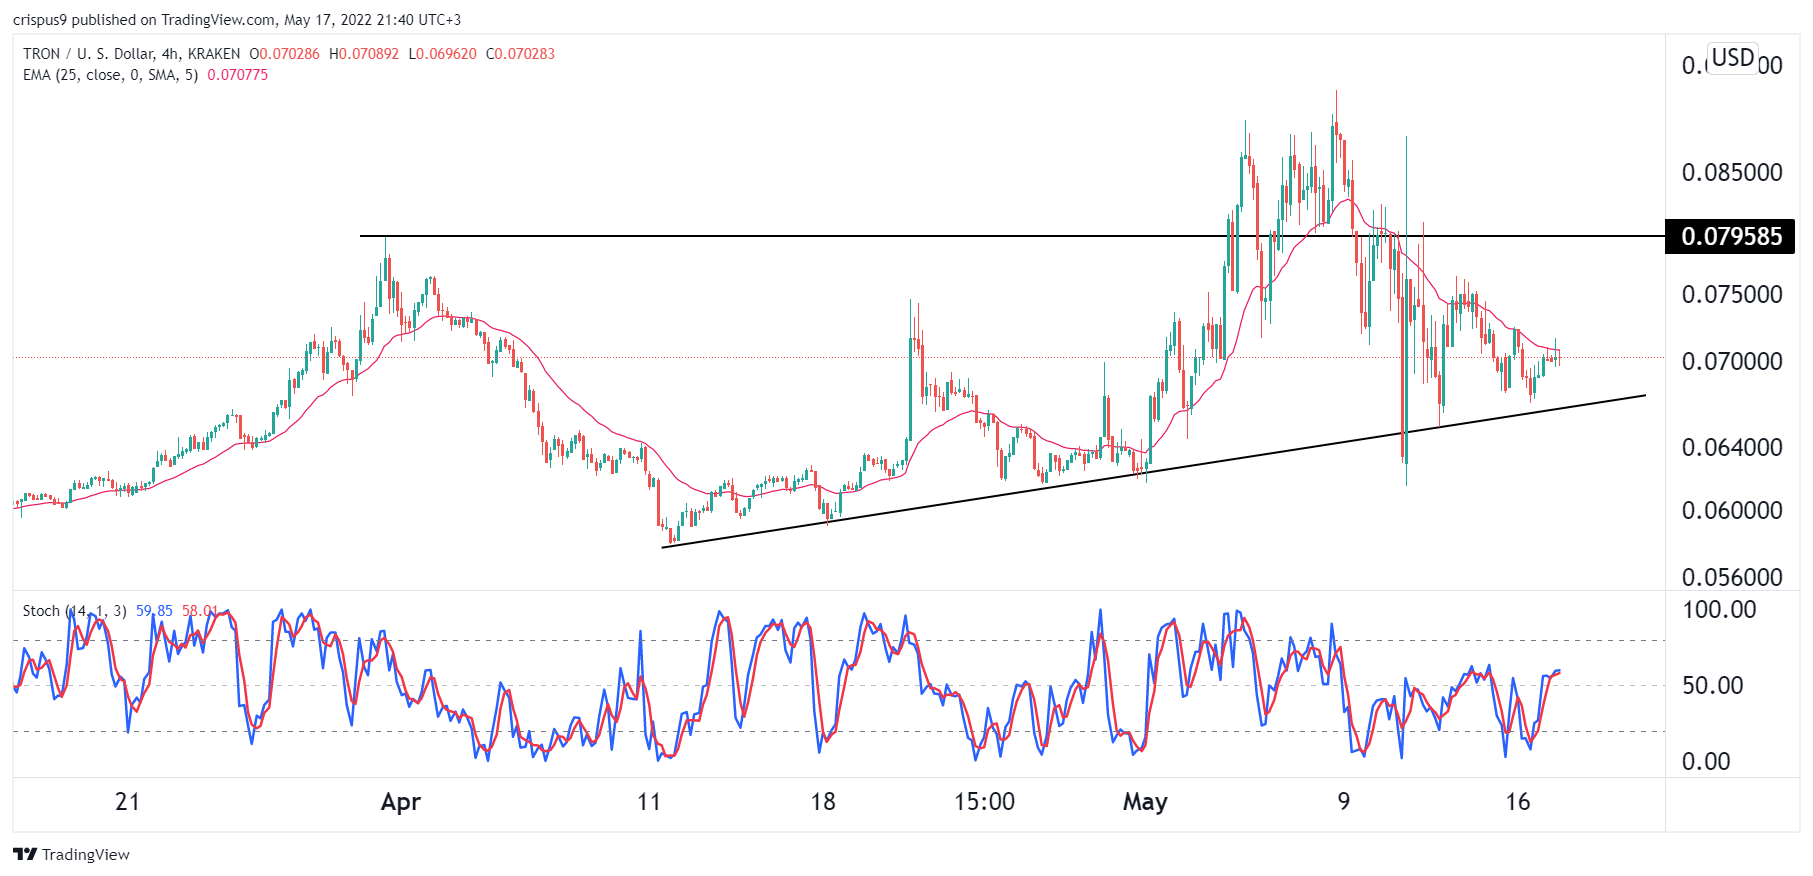
The Tron price has been a bit volatile in the past few days as worries about its newly launched USDD stablecoin that has a close resemblance to Terra USD. The coin is trading at $0.069, which is about 25% below the highest level last week. Its total market cap has declined to about $6.82 billion.

USDD concerns remain

The biggest story in the cryptocurrency this month was the collapse of Terra USD, the third-biggest stablecoin in the world. At its peak, it was the third-biggest stablecoin in the world after Tether and USD Coin.

Another big story was the launch of USDD Coin by Tron. USDD is a stablecoin that closely resembled Tron USD in that it is not backed by US dollars. Instead, it is an algorithmic stablecoin that automatically rebalances when it moves below or above $1. 

USDD has been one of the most successful stablecoin launches ever. In less than three weeks, its total market cap has jumped to over $310 million. This makes it one of the biggest stablecoins in the world and the 147th biggest coin globally.

Read more on how to buy Terra Luna.

The TRX price has declined because of worries of the USDD stablecoin. With algorithmic stablecoins like DEI, Neutrino, and Terra USD losing their peg, there are concerns that USDD also could do the same. For now, however, the coin’s peg has held relatively well and has ranged between $0.998 and $1.01.

Tron price has also declined because of the weak performance of its DeFi platform. Like all platforms, its total value locked has crashed hard in the past few days. It has dropped slightly to about $4.2 billion, making it the 4th biggest chains in the world.

Tron price prediction

Turning to the four-hour chart, the TRX price jumped to a high of $0.092 as demand for the USDD coin rose. In the past few sessions, however, the coin has retreated sharply and moved below the 25-day and 50-day moving averages. The coin remains above the ascending trendline that is shown in black.

Tron’s Stochastic Oscillator has moved slightly above the neutral level at 50. Therefore, the outlook for the Tron price is a bit bearish, with the next key support level being at $0.065. A move above the resistance at $0.0072 will invalidate the bearish view.

The post Tron price prediction: USDD concerns remain appeared first on Coin Journal.

Maker (MKR) price could soon plummet as rising wedge forms

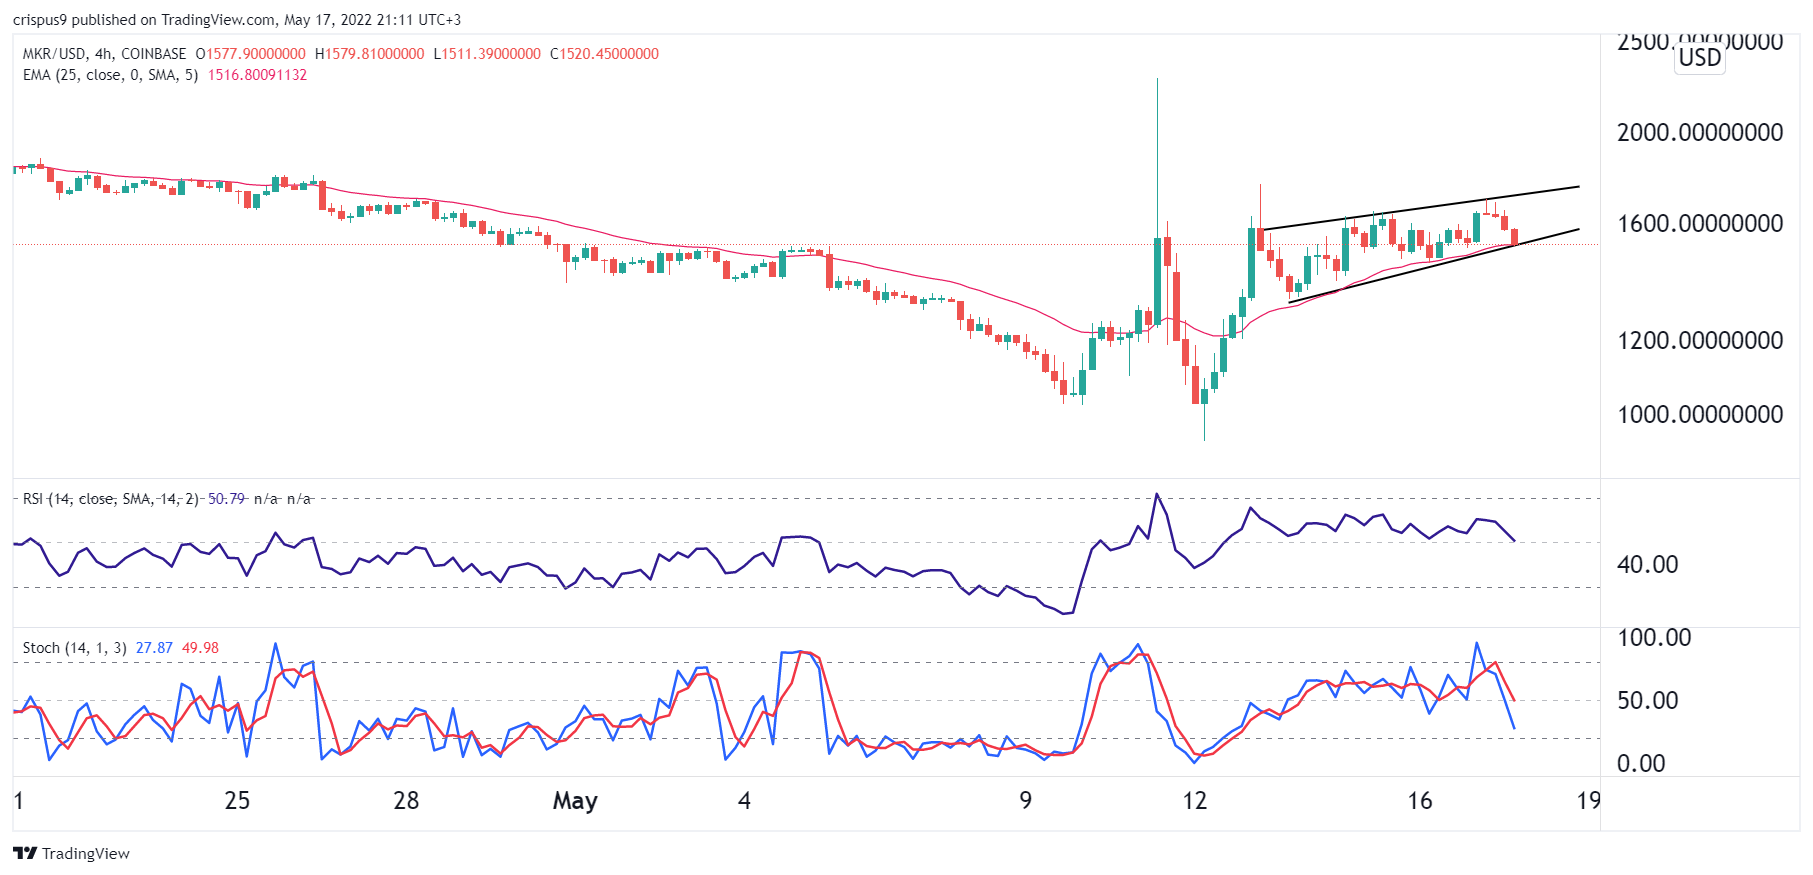
The Maker price has been in a consolidation mode in the past few days as investors assess the strength of the DeFi industry and its Dai stablecoin. MKR is trading at $1,544, which is in the same range it has been recently. This price has risen by more than 64% from its lowest level last week. It now has moved to over $1.4 billion, making it the 51st biggest coin in the world.

MKR rally fizzles

Maker is the biggest DeFi platform in the world with more than $10.5 billion locked in its ecosystem. It is a decentralized autonomous organization (DAO) that allows people to generate a stablecoin known as Dai by leveraging collateral assets provided by Maker Governance.

Dai is a stablecoin that is relatively different than Tether and USD Coin. Unlike these two, it is soft-pegged to the US dollar. However, it is decentralized in nature and its collateral assets are deposited in Maker vaults.

The Maker price rose sharply in the past few days as investors embraced Dai after the collapse of Terra LUNA, Terra USD, and affiliated DeFi networks like Anchor Protocol and Astroport. In the past few days, the total market cap of Dai has jumped to more than $6 billion, making it the 17th biggest coin in the world. It has become the third-biggest stablecoin in the world after Tether and USD Coin.

Read our comprehensive review of eToro.

Still, a closer look at its ecosystem shows that people have pulled out their cash from the network after the collapse of Terra. Its total value locked (TVL) in the network has declined to about $10.5 billion, which is the lowest it has been since July last year. At its peak, it had a TVL of over $20 billion.

Maker price prediction

The four-hour chart shows that the MKR price has moved sideways in the past few days. The coin moved slightly above the 25-day moving average while the Relative Strength Index and the Stochastic Oscillator have tilted downwards.

However, a closer look shows that the coin has formed a rising wedge pattern, which is usually a bearish sign. Therefore, the outlook of Maker is bearish, with the next key support level to watch being at $1300. A move above the resistance level at $1,650 will invalidate the bearish view.

The post Maker (MKR) price could soon plummet as rising wedge forms appeared first on Coin Journal.
Here is why MATIC is up by more than 6% today

Polygon Logo on a mobile phone screen

The cryptocurrency market has performed well over the past 24 hours as it slowly recovers from its recent slump.

The broader crypto market has added more than 2.5% to its value over the last 24 hours. This comes despite a poor start to the week. 

Thanks to the positive performance recorded over the past 24 hours, the total cryptocurrency market cap now stands above $1.3 trillion.

Bitcoin remains the dominant cryptocurrency and could cross the $31k mark if the market rally continues. Ether is also eyeing the $2,100 resistance level after adding nearly 3% to its value in the last 24 hours.

MATIC, the native token of the Polygon ecosystem, is one of the best performers amongst the top 20 cryptocurrencies so far today. MATIC, along with Avalanche, Cronos and Litecoin, have added more than 6% to their values in the last 24 hours.

For MATIC, the primary catalyst behind its ongoing positive performance is the partnership between Polygon and Ernst & Young (EY), one of the Big Four auditing firms.

The Polygon team said the partnership will see the entities launch the first-ever Layer 2 Zero-Knowledge (ZK) on the Polygon mainnet. 

Key levels to watch 

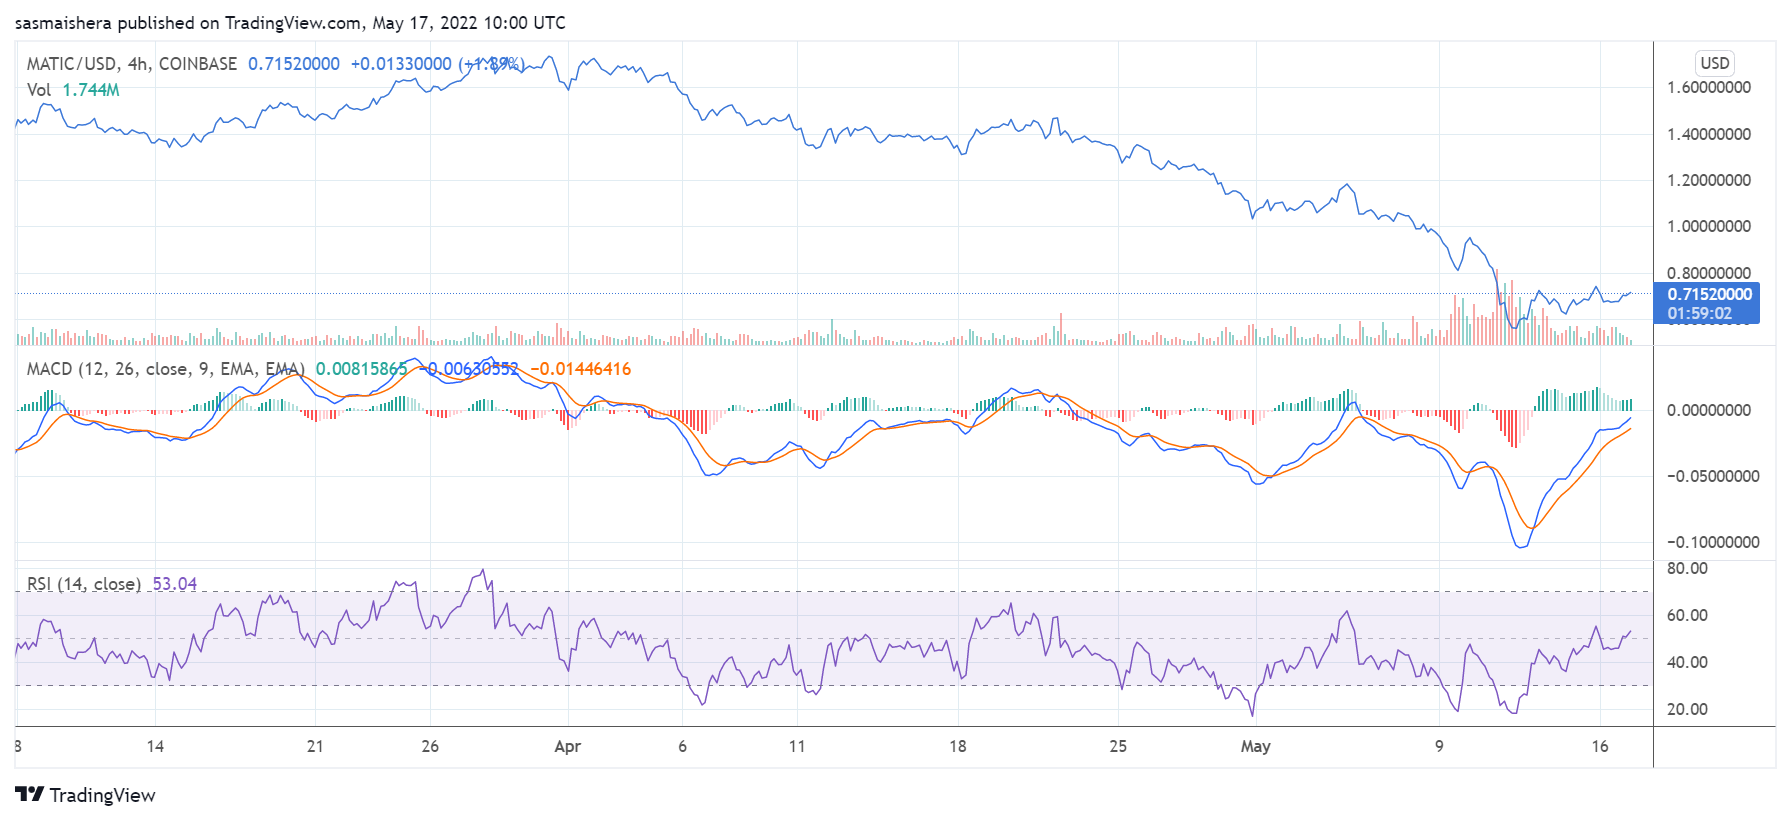
The MATIC/USD 4-hour chart is bearish. This isn’t surprising as MATIC has underperformed in recent weeks. 

The MACD is below the neutral zone, indicating that the bearish sentiment is not completely over. The 14-day relative strength index of 52 shows that MACD is no longer in the oversold region.

At press time, MATIC is trading at $0.7139. If the rally continues, MATIC could break past the first major resistance level at $0.8087 before the end of the day. However, the resistance level at $0.9568 should cap further upward movement in the short term. 

The post Here is why MATIC is up by more than 6% today appeared first on Coin Journal.

DeFi Dips: Top coins to buy while the price is low

As crypto starts to see some recovery after major losses last week, keen investors will be scanning the market for the best dips to buy. Well, one area where such opportunities are is in DeFi. Most DeFi coins have sharply fallen. Here is why this is the best time to buy:

  • DeFi will almost certainly bounce back in the near term

  • Decentralized Finance is the future of blockchain technology

  • Current dips offer investors the perfect chance to buy heavily discounted DeFi projects.

As noted above, there are many superb dips in the DeFi space to take advantage of. Check out the top 3 listed below:

Uniswap (UNI)

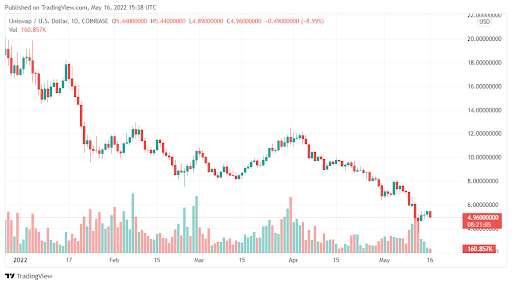
Uniswap (UNI) has seen its value decline by over 25% in the last 7 days. The DEX has also reported sharp losses from its 2022 highs. In fact, UNI is almost 3 times cheaper than it was a few weeks ago. 

Data Source: Tradingview 

If you have always wanted to get it but felt the price was too high, this is the perfect opportunity to pounce. After all, Uniswap is the largest DEX on Ethereum and the largest in the world. The long-term value that it can deliver is simply too good.

Convex Finance (CVX)

Convex Finance (CVX) is one of the biggest liquidity protocols in crypto. The project has nearly $6.6 billion in Total Value Locked so far. It simply allows users to deposit liquidity and earn boosted rewards in return. CVX has however fallen by almost 50% over the last 7 days. This discount makes it a great choice for DeFi dip buyers.

Yearn Finance (YFI)

Yearn Finance (YFI) has dropped out of the top 100 most valuable crypto projects. The coin has lost nearly 35% in a week. YFI is however backed by some outstanding investors and a great pedigree in the market. It’s just a matter of time before it fully recovers.

The post DeFi Dips: Top coins to buy while the price is low appeared first on Coin Journal.