

As the crypto market roars back modestly, Shiba Inu has been posting massive gains. Over the past three days alone, the coin is up nearly 55%. However, it looks like this upward momentum is about to face its biggest test yet. SHIB is now facing a major resistance zone. Will it manage to keep going? Here are some takeaways:
-
SHIB faces major resistance at the $0.0000104 mark
-
A rejection at this price could trigger a decisive pullback
-
SHIB however appears to have enough momentum to overcome
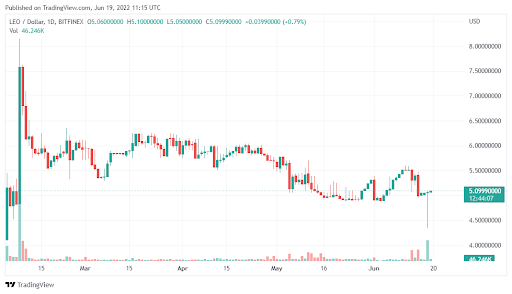
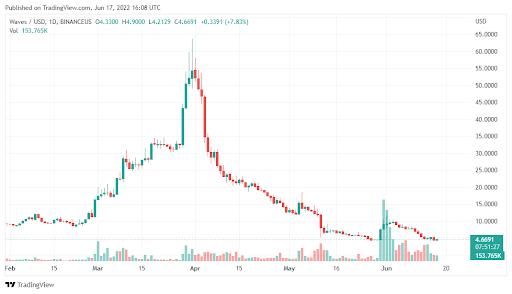
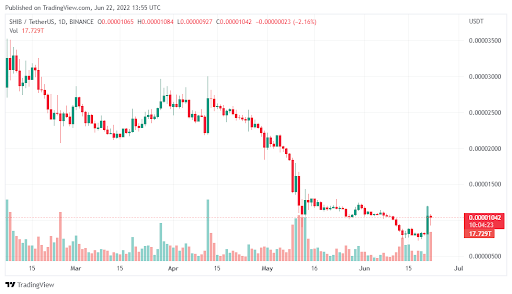 Data Source: TradingView
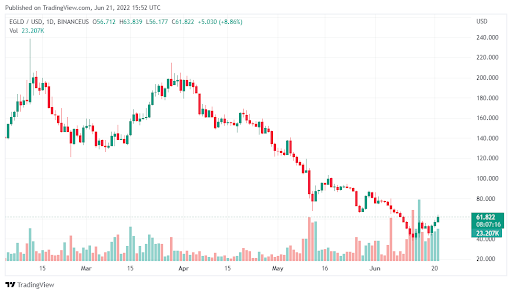
How long will SHIB rally?
After gaining 14% over the last 24 hours, SHIB is now outperforming the market. The coin has also reported gains on its fourth straight day. This renewed momentum comes against the backdrop of growing uncertainty in investor sentiment around meme coins. But despite this, SHIB now faces its biggest hurdle as it tries to overcome the $0.0000104 resistance.
If the coin fails to clear this price, we are likely to see at least a 17% pullback. SHIB will then consolidate and try again. However, we believe that there is enough momentum for SHIB to in fact rise above this mark.
The coin has rallied in the past 24 hours and is getting closer and closer to $0.0000104. Once the barrier is breached, SHIB could run further by another 25% before any breakdown. This will represent one of the sharpest rebounds in the market in June.
Why is SHIB surging?
As noted above, SHIB is outperforming the entire market during this small recovery phase. It seems though that much of these gains have come as SHIB’s demand among whales grows further.
We are also seeing some slight improvements in sentiment across the market. As such, trade volume for the meme coin has shot up slightly. If these conditions hold in the near term, SHIB will likely keep rising.
The post Shiba Inu’s 55% rally could lose steam as it faces a major resistance zone appeared first on CoinJournal.

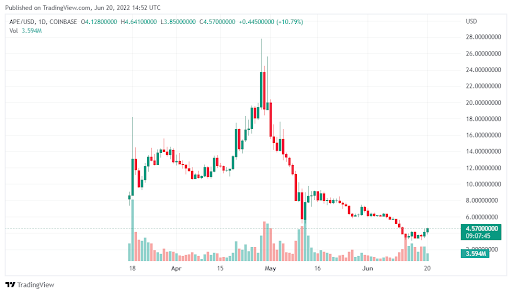
 Data Source: TradingView
 Data Source: TradingView
 Data Source: TradingView
 Data Source: TradingView