This little-known altcoin has jumped by 50% in a week. Does it still have an opportunity?

As digital assets continue to endure a crypto winter, Arweave is crafting a name for itself. The cryptocurrency nearly doubled in value in November. The monthly lows remain at $10, with the highest at $17.8 on November 3. Arweave’s token has fallen back to $10.8, and investors could be looking at it as a potential buy on the dip. Should you? 

Arweave is a Decentralised Storage Network or DSN. It allows people needing extra computer storage solutions to connect with those with extra capacity. Arweave is unique in that it permits permanent storage for a single payment. That makes Arweave different from other blockchain-related storage solutions like Filecoin, which involve multiple payments.

Arweave token (AR/USD) has been of interest to investors this month after impressive cryptocurrency news. Meta had announced that it would use Arweave to store its non-fungible tokens on its social media platform. That emphasises that big corporations see the opportunity offered by the blockchain platform. The question now is, can the token sustain the bullish momentum it started this month?

AR on a retracement after the latest gains

Source – TradingView

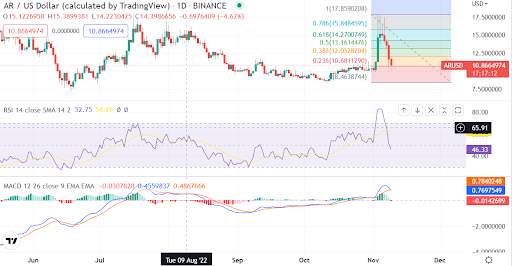
Technically, AR met resistance at the $17.8 level. The zone is a long-term resistance that the cryptocurrency has retested severally in the past. The level is the swing high on the Fibonacci retracement, while the swing low is $8.4.

From the daily chart above, the Fibonacci retracement levels are $10.681 (23.6%), $12.052(38.2%), $13.16(50%), and $14.27(61.8%). The token is testing the 23.6% Fib level. The MACD indicator is bullish, but momentum is waning. 

Should you buy AR?

While the latest price action is positive for AR, we remain cautious about sustainability. The $17.8 level remains a stumbling block for further upside. Coinciding with a weak crypto sector outlook, a sustained price recovery may be hard to register for AR.

Should a bullish momentum remain for AR, we expect a retest of the $17.8 resistance. On the flip side, AR could next test the $10 support. Also, watch the Fib levels for potential price corrections.

Where to buy AR

Capital.com

Capital.com is a global broker which offers over 200 cryptocurrencies for its users. It comes with a range of features such as; great security, 24/7 support, demo accounts and a wide variety of assets. On top of that, it also has no inactivity, withdrawal or deposit fees, which makes it stand out from other crypto brands.

Buy AR with Capital.com today

Binance

Binance is one of the largest cryptocurrency exchanges in the world. It is better suited to more experienced investors and it offers a large number of cryptocurrencies to choose from, at over 600. Binance is also known for having low trading fees and a multiple of trading options that its users can benefit from, such as; peer-to-peer trading, margin trading and spot trading.

Buy AR with Binance today

The post This little-known altcoin has jumped by 50% in a week. Does it still have an opportunity? appeared first on CoinJournal.

Should you buy Optimism as token tests support

Optimism (OP) remains in a bullish market. The token tested a monthly-high resistance of $1.37, although it is not cooling down. Its trading volumes are, however, up 54% at $355 million in the past day. The blockchain has been recording significant trading activities. 

Data from DefiLlama shows a significant gain in Optimism’s TVL over the last three months, peaking at $1.15 billion in August. The growth could be attributed to developers looking for scalability in Ethereum. 

Optimism is a layer-2 blockchain on Ethereum aimed at the scalability of decentralised applications. The platform launched its testnet in September 2020. Its native OP token allows end users to access dApps on Ethereum cheaply. OP is also useful in governance by granting holders voting rights in the Optimism Collective.

The current price dynamics of OP token is not tied to anything specific in the industry. However, the fundamentals around scalability have growth potential. Specifically, Optimism rollups, which wrap up transactions into one, could popularise the layer-2 platform.

OP retraces to $1 support amid a bullish momentum

Source: TradingView

The daily technical chart above shows that OP is retesting the support at or around $1. The token looks to have slightly lost the $1 level, although we need further confirmation. A close of the daily candlestick will confirm if a bearish breakout has occurred. To the upside, the immediate resistance is at $1.4, while $1.9 is the longer-term resistance level.

MACD looks bullish, while the RSI has remained below the overbought zone, meaning it could go higher. 

Concluding thoughts

Based on the fundamental aspects, OP could bring value to its users in the long term. From the technical chart, the token is retesting support with a bullish momentum. Although the token is on a retracement, a bounce off from the support level could occur.

A confirmation of a bullish price action signal would welcome an upside momentum for Optimism. At the current price, it would be prudent to exercise patience until proper buy signals pop up at the immediate support level.

Where to buy OP

The post Should you buy Optimism as token tests support appeared first on CoinJournal.

Is Shiba Inu’s bull run over? Here is the technical outlook

Cryptocurrencies continue to slide in a new week despite enthusiasm settling in previously. Shiba Inu (SHIB/USD) is one such cryptocurrency that posted massive gains. That allowed SHIB to overcome $0.000012 resistance, a key level that has always been watched as a price pivot. Consequently, SHIB went higher to a nearly 3-month high of $0.000015 on October 29.

At $0.000010, SHIB has suddenly become bearish. That comes after a key technical level at $0.000012 failed to hold. The losses come amid concerns about huge amounts of SHIB being moved from the embattled FTX exchange. Etherscan data showed that whales transferred almost 1.5 trillion SHIB from the FTX exchange. The movement coincided with a nearly 10% price decline in SHIB on the same day.

SHIB slides below the $0.000012 support as weakness mounts

Source – TradingView

A technical outlook shows SHIB trending down after bulls failed to hold firm the $0.000012 level. The price has also lost the 20-day and 50-day moving averages, underlining increasing bear pressure.

The relative strength index shows a sharp selloff. The token is yet to hit the oversold levels, with the reading below the midpoint. 

What next for SHIB?

Shiba Inu is currently under the control of bears. A weak momentum and bearish indicators reinforce a further drop in the price.

The area around $0.000008 is the next to watch should bulls fail to arrest the current weakness in SHIB. If bulls enter positions, SHIB price could rise to find resistance at $0.000012 again. A potential bullish momentum will be confirmed by a price recovery above the $0.000012 resistance. 

Buyers should keep off SHIB for now until a proper bull confirmation. However, surprise recoveries on new developments should be monitored as SHIB is already known for that.

Where to buy SHIB

eToro

eToro is a global social investment brokerage company which offers over 75 cryptocurrencies to invest in. It offers crypto trading commission-free and users on the platform have the option to manually invest or socially invest. eToro even has a unique CopyTrader system which allows users to automatically copy the trades of popular investors.

Buy SHIB with eToro today

Capital.com

Capital.com is a global broker which offers over 200 cryptocurrencies for its users. It comes with a range of features such as; great security, 24/7 support, demo accounts and a wide variety of assets. On top of that, it also has no inactivity, withdrawal or deposit fees, which makes it stand out from other crypto brands.

Buy SHIB with Capital.com today

The post Is Shiba Inu’s bull run over? Here is the technical outlook appeared first on CoinJournal.

Solana clears above the 50-day MA. Is it now bullish?

Solana (SOL/USD) jumped to a 2-month high of $38.7 over the weekend. The strong recovery happened after Google Cloud announced it had become a Solana validator.  

Google Cloud further said it would continue working with the Layer-1 blockchain. The partnership will see the introduction of Blockchain Node Engine to the blockchain in 2023. Solana is now expected to become the payment service for Google Cloud services.

Aside from the recent developments, Solana has witnessed increased growth. In late September, the total transactions on the blockchain rose past the hundred billion mark for the first time. Of course, that comes when Solana enthusiasts continue to express concern over the frequent network outages. The increasing adoption means investors see real use cases for the proclaimed Ethereum killer.

Elsewhere, a pseudonymous crypto analyst Cantering Clark is too optimistic about SOL recovery. In a note to his 149,500 Twitter followers, Clerk says SOL is forming a multi-month base. He posits that the cryptocurrency is taking out a diagonal resistance and is consistently getting a green light.

Aside from the positive fundamentals, technical indicators show SOL attempting to break a key level.

SOL rejected at $37, another attempt for buyers to push higher?

Source – TradingView

Technically, SOL was rejected at the $37.6 resistance zone. The token attempted a breakout after a strong rally over the weekend. The jump helped the cryptocurrency to recover above the 50-day MA for the first time since mid-August.

The MACD indicator shows a bullish momentum for SOL. However, the momentum has slightly weakened after a 10% SOL price drop on Monday.

Will SOL go higher?

The $37.6 is the key litmus test for SOL. There is already an indication that buyers are rejecting a price drop below the 50-day MA. Should buyers remain resilient, we vouch for SOL’s break above $37.6. That will open a buy trade and set it for a price increase to $42 and the main resistance at $47.

Another price rejection at $37.6 could see buyers wait longer for SOL to go higher. If the price breaks below the moving averages, a bear market could continue for SOL.

Where to buy SOL

eToro

eToro is a global social investment brokerage company which offers over 75 cryptocurrencies to invest in. It offers crypto trading commission-free and users on the platform have the option to manually invest or socially invest. eToro even has a unique CopyTrader system which allows users to automatically copy the trades of popular investors.

Buy SOL with eToro today

Capital.com

Capital.com is a global broker which offers over 200 cryptocurrencies for its users. It comes with a range of features such as; great security, 24/7 support, demo accounts and a wide variety of assets. On top of that, it also has no inactivity, withdrawal or deposit fees, which makes it stand out from other crypto brands.

Buy SOL with Capital.com today

The post Solana clears above the 50-day MA. Is it now bullish? appeared first on CoinJournal.

The Graph token price prediction after a 12% jump

The Graph token (GRT/USD) rose by a dozen percentage points on Thursday. The token was among the few gainers on the day after a market drop following the Fed’s rate hike. CoinMarketCap showed a surge in trading volumes, coinciding with the price surge. The gains elicit the question, how sustainable is GRT? 

The Graph claims to be an indexing protocol. Users can use the platform to query other networks, including Ethereum and IPFS. The protocol allows anyone to create and publish subgraphs, or open APIs, further broadening data decentralisation.

Alongside the investor interest on Thursday, The Graph was projected to benefit immensely from the Ethereum Merge. However, since the Merge, GRT price has been a beaten-down cryptocurrency. That’s because of the querying function that The Graph provides to Ethereum. Consequently, The Graph has been recognised as key to Ethereum’s scaling plans. 

The gains in The Graph underline positive expectations the protocol will play in the post-Merge period. Going by the fundamentals, investors could see the Graph as a favourable investment in the PoS ETH era. 

GRT meets resistance after the intra-day gains

Source – TradingView

Technically, The Graph token has met resistance at $0.092. The token is undergoing a correction at the resistance zone. Although it broke past the resistance, a close of the daily candlestick below could invalidate a bullish view. However, the RSI remains above the midpoint, implying buyers are still active on the token.

What next for GRT?

The cryptocurrency has to clear the resistance level to consider a buy attractive. We need to wait for the close of the daily candlestick to assess the next price direction. A bullish breakout will allow buyers to target $0.10 and $0.12 next.

Where to buy GRT

eToro

eToro is a global social investment brokerage company which offers over 75 cryptocurrencies to invest in. It offers crypto trading commission-free and users on the platform have the option to manually invest or socially invest. eToro even has a unique CopyTrader system which allows users to automatically copy the trades of popular investors.

Buy GRT with eToro today

Capital.com

Capital.com is a global broker which offers over 200 cryptocurrencies for its users. It comes with a range of features such as; great security, 24/7 support, demo accounts and a wide variety of assets. On top of that, it also has no inactivity, withdrawal or deposit fees, which makes it stand out from other crypto brands.

Buy GRT with Capital.com today

The post The Graph token price prediction after a 12% jump appeared first on CoinJournal.