Terra (LUNA) price points to potentially more gains short term

  • Terra (LUNA) rallies as demand for UST is driven by Anchor Protocol surges.

  • LUNA’s relationship with UST means higher demand for UST drives LUNA prices up.

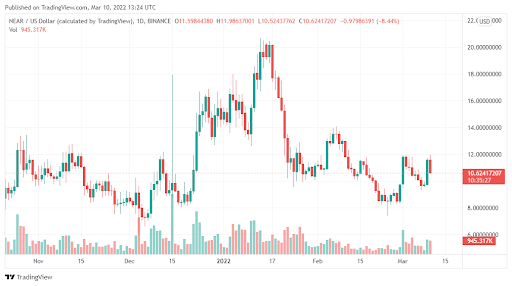
  • LUNA is currently trading in an ascending triangle pattern, an indicator of a potential breakout.

Terra (LUNA) continues to outperform the rest of the market by a huge margin. LUNA is the only major cryptocurrency that has retested its all-time highs since the crypto market turned bearish in November 2021.

The trigger behind this rally has to do with the relationship between LUNA and the stable coins that run on the Terra ecosystem, such as TerraUSD (UST). As the demand for UST grows, LUNA is burned, with the goal being to keep UST pegged 1:1 to the dollar. Going by the economic laws of demand and supply, the more LUNA is burned, the higher the price goes.

Recently there has been a huge demand for UST, as investors look to lend it on Anchor Protocol, a platform with an APY of up to 20%. This also means that the burn rate for LUNA has shot up, and by extension, the price has also gone up to the levels where it is now.

As long as Anchor Protocol keeps paying an above-average APY, then the chances are that LUNA could easily go on to make new highs, possibly above $200 in the short term.

LUNA trading in an ascending triangle
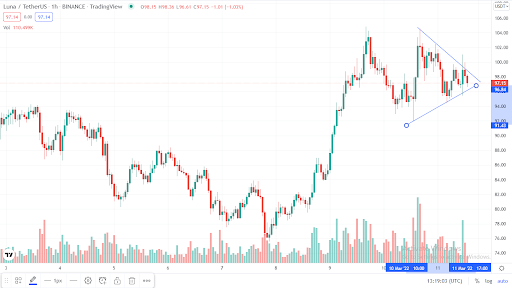
Source: TradingView

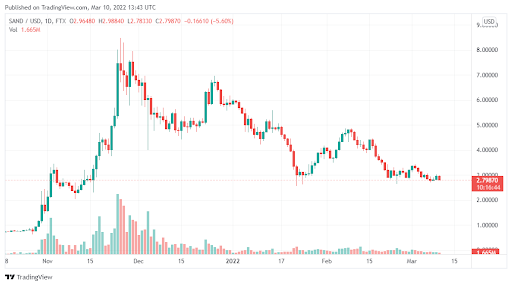
After the rally that saw it make new highs a few days ago, Terra is trading in an ascending triangle. This is an indicator of a potential breakout, which could see LUNA test prices it has never tested before.

Summary

LUNA is the only one of the major cryptocurrencies that are rallying. Its price action points to a potential continuation of the rally that started a few days ago and could see LUNA make new highs in the short term.

The post Terra (LUNA) price points to potentially more gains short term appeared first on Coin Journal.

Hedera (HBAR) remains above crucial support zone despite recent drop – Can it reverse the downtrend?

Hedera HBAR Coin Logo

The general weakness seen in the crypto market over the last few days has seen many coins drop, and Hedera (HBAR) is not any different. But despite this, the coin still remains above a crucial support zone. How long can it actually stay there? Here are some highlights first:

  • The $0.19 support remains critical for HBAR in the coming days.

  • The coin is currently above that, trading at around $0.201.

  • If HBAR fails to hold this support, it could fall to $0.15.

Data Source: Tradingview 

Hedera (HBAR) – What to watch?

The volatility in the crypto market has made it very hard to predict price action based on technicals alone. But one thing we know about HBAR is that the $0.19 support has held quite strongly despite recent weakness. The key for bulls right now is to consolidate around this price. 

So far, HBAR is doing well and is trading at around $0.2. Once the price consolidates, the next leg up could take HBAR towards $0.34. But if bears keep pushing and HBAR sinks below $0,19, then we are likely to see more weakness. 

In fact, the coin is likely going to the bottom at $0.15. There is even a risk that persistent weakness could push the price towards its February lows of $0.09.

Who should buy Hedera (HBAR)?

Hedera (HBAR) is an enterprise-grade network that is hoping to power the decentralized economy. The project has attracted a lot of investment, and with a market cap of around $4 billion, it is one of the biggest crypto assets in the market right now.

So, if you are looking for cryptos that have serious utility and positive long-term outlooks, Hedera (HBAR) will be perfect. The project has diversified its service and continues to attract developers in large numbers. It has the potential of becoming as big as Ethereum.

The post Hedera (HBAR) remains above crucial support zone despite recent drop – Can it reverse the downtrend? appeared first on Coin Journal.

ECOMI (OMI) is up 20% from two-week lows – Here is where the price might go next

ECOMI (OMI) appears to be rebounding sharply after hitting two-week lows at the start of last week. This comes even as the market continues to see increased volatility across the board. But how far can the price actually go? Here are some highlights:

  • ECOMI (OMI) has reported gains of nearly 20% since hitting two-week lows last Tuesday

  • The coin is also above its 25- and 50-day moving averages.

  • At press time, ECOMI (OMI) was trading at $0.004253, down around 5% for the day.

Data Source: Tradingview

ECOMI (OMI) – Price prediction and analysis

The sharp rebound that we have seen in the last two weeks appears to have pushed ECOMI (OMI) into bullish territory. For starters, the coin is now trading well above its 25- and 50-day simple moving averages. This could suggest that we may see a bullish breakout sustained in the days ahead. 

Also, the MACD is now above the neutral zone, which suggests that the price momentum is ascending. However, ECOMI (OMI) will need to overcome a very crucial overhead resistance of $0.48. While this is not impossible, the coin has been rejected at that zone several times. 

And when you consider the volatility in the market right now, the downside risks are simply huge. But the bullish alignment we have seen could edge ECOMI (OMI) further ahead in the long term.

Is ECOMI (OMI) a good asset?

Based in Singapore, ECOMI (OMI) focuses on digital collectibles. Think of it as the ultimate NFTs platform. The project also operates the VeVe NFT marketplace, where users can buy and sell collectibles. 

With NFTs now expected to grow even further in the years ahead, ECOMI (OMI) will grow with them. Therefore, there is a lot of potentials here for long-term investors to make great returns.

The post ECOMI (OMI) is up 20% from two-week lows – Here is where the price might go next appeared first on Coin Journal.

Near Protocol (NEAR) could rally to $14 in the coming days

After going through a mini correction last week, The Near Protocol (NEAR) is emerging from the dumps. The coin has surged and could hit $14 in the coming days. But what are some of the risks? Analysis to follow here below but first, some important highlights:

  • NEAR has regained its crucial $9.5 support after the recent rally.

  • The coin could surge towards $14 if NEAR holds that support level.

  • The altcoin was selling for $10.59 at press time.

Data Source: Tradingview 

Near Protocol (NEAR) – Price analysis

After regaining the crucial support of $9.5, it seemed like NEAR was on the up and up. The coin has however slowed in the upward ascend and we have seen a small pullback. But despite this, NEAR still trades at $10.5, way higher than the $9.5 support zone. If indeed bulls can keep the coin above that, there is enough upward momentum left to shoot NEAR towards $14. 

The most important thing to watch as of now will be the overhead resistance of $11.7. NEAR has been rejected several times at this zone, but if the bulls can push above it before the end of the week, then a bullish breakout is very feasible. 

However, there is still a sell-off risk, owing to the volatility in the market. If bears break the $9.5 mark, then NEAR could fall even further towards $8 before it rises again.

Why are investors buying The Near Protocol?

With a market cap of $6.8 billion, NEAR is a big project with a lot of investors. The layer one blockchain is designed to offer a “community-based” cloud computing ecosystem with extra fast speeds, low gas fees, and usability. 

The project has supported the launch of several innovative DApps and looks poised to become one of the biggest blockchain projects in the coming years. It’s by far a great investment for the future.

The post Near Protocol (NEAR) could rally to $14 in the coming days appeared first on Coin Journal.

Sandbox (SAND) shows positive RSI divergence – Is a bullish breakout coming?

Sandbox (SAND) has been bouncing positively in the last few days. News that the US is going to launch a digital dollar improved sentiment in the market. Most coins, including SAND, saw bumps in value. But an emerging RSI divergence could suggest that SAND could in fact surge further ahead. Here are some highlights:

  • Despite pulling back slightly, SAND still remains above the crucial support of $2.74.

  • The metaverse token was trading at $2.81 at the time of writing this post.

  • The RSI shows a crucial divergence that could push the price further in the days ahead.

Data Source: Tradingview 

Sandbox (SAND) – How far can it go?

Sandbox (SAND) has come under severe selling pressure in the last few weeks. But the coin has maintained its monthly support of $2.74. Although there is still a lot of volatility in the market, we expect SAND to keep price action above that point. At press time, the coin was actually trading at $2.81. 

The $2.74 mark, at least looking over the last month, has also been a crucial consolidation zone. If indeed SAND is able to consolidate gains above it, there could be an upside towards the next overhead resistance of $3.42. 

But despite this, SAND still remains lower than its 50 and 100-day daily moving averages. The coin is even lower than the 200 DMA. This suggests the overall trend remains bearish at best. In fact, if bulls don’t hold the $2.74 support, SAND could fall below $2 in no time.

Is Sandbox ideal for any investor?

Well, it really depends on your investment plan. For folks who want some exposure on the metaverse and related tokens, then SAND is a good buy. Remember, this was one of the top-performing coins in 2021, and it could return the same gains this year. It’s therefore an ideal coin to purchase today.

The post Sandbox (SAND) shows positive RSI divergence – Is a bullish breakout coming? appeared first on Coin Journal.