Quant ( QNT) has been rallying over the last week or so. The coin managed to hit 3-week highs after losing much of its 2021 gains in January. But will this bullish uptrend bring sustained gains in the near term? Price action and analysis here below but first, some highlights:
-
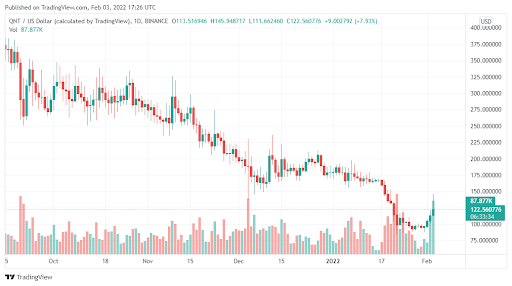
At press time, QNT was trading at $126, up nearly 13% in what is the largest single-day gain this year.
-
Despite this, QNT is still below the crucial psychological zone of around $150 even with the bullish run.
-
Quant ( QNT) has been making moves in Central Bank Digital Currencies (CBDCs), something that may push prices higher.
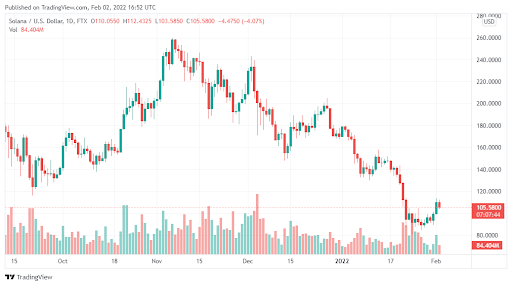
 Data Source: Tradingview.com
Quant ( QNT) – Near term predictions and analysis
After losing steam at the start of 2022, it seems like Quant (QNT) is well and truly on a path of full recovery. The token has been rising for the last 4 consecutive days and is now nearly 32% up from the lowest price recorded this year.
Despite this, QNT is still way lower than its all-time high of $325 and is yet to surge past the crucial psychological zone of $150. But things are looking good.
In fact, recent reports indicate that the network has been making serious moves on Central Bank Digital Currencies, something that may deliver real value in the long term. We expect this bullish surge to continue in the coming days.
Why should you buy Quant (QNT)?
QNT often comes off as a very underrated and undervalued asset. With a market cap of around $1.5 billion, there is just so much room for growth here. Besides, QNT also appears to be developing its ecosystem and embracing new innovations to power its growth. If you are looking for a blockchain project that promises immense value for the future, then QNT is highly recommended.
The post Quant ( QNT) surges to a 3-week high – Can this bullish momentum bring sustained gains? appeared first on Coin Journal.

 Data Source: Tradingview.com
 Data Source: Tradingview.com