BNB/USD vulnerable as a bearish flag formation points to a move below $200

  • BNB/USD forms a possible bearish flag pattern
  • The US dollar strength is not responsible for the BNB/USD bearishness
  • $200 provides support for now

Bitcoin rallied in 2023 and holds onto its gains. Most other major cryptocurrencies did so too, but some exceptions exist. 

One is Binance Coin (BNB). 

Sure enough, it rallied at the start of the year, following Bitcoin’s lead. But then it gave up all of its gains – and some more. 

One cannot blame the US dollar’s strength as the cause for the BNB/USD decline. After all, the dollar’s strength is not visible in other cryptocurrencies. 

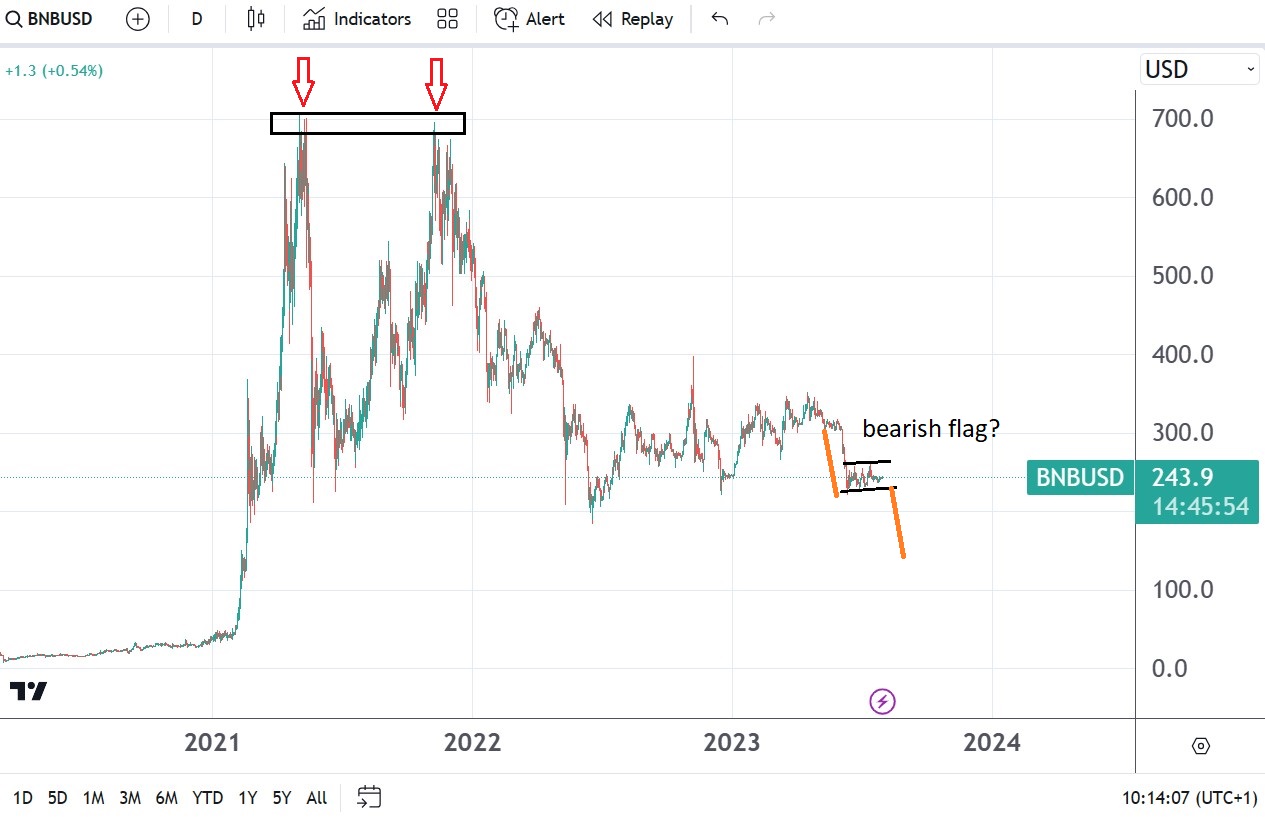
Instead, it appears to be the Binance Coin that trades with a bearish tone. That is particularly true if one looks at the technical picture, which shows the bearish pressure building as the market nears the $200 support level. 
Binance Coin chart by TradingView

A bearish flag pattern suggests that BNB/USD will break the $200 support level

A bearish flag pattern is a continuation pattern forming in a downtrend. The consolidation area follows a steep decline, and the breakout or the measured move equals the distance that the market traveled prior to the consolidation. 

If, indeed, BNB/USD formed a bearish flag pattern, then the support in the $200 area should give way. The pattern’s measured move, seen in orange above, points to $150 and lower. 

What should worry investors is the inability of the market to bounce while other cryptocurrencies hold near their yearly highs. It points to other factors weighing on the market, different than the US dollar’s strength. 

The post BNB/USD vulnerable as a bearish flag formation points to a move below $200 appeared first on CoinJournal.

BALD token records astounding 40,000% upside after launch on Base

  • The meme token recorded astounding gains in 24 hours, reaching a market cap of $70 million.
  • BALD, the newly-launched meme coin that went live on Base, a layer-2 chain created by Coinbase on Ethereum, skyrocketed within hours of its launch to jump to a market cap of $70 million.

While the current price of Bald is $0.06, up by about 70% in the past 24 hours, the meme coin’s astounding gains after its launch took the crypto trading world by storm with a 40,000% jump.

Currently, data from CoinGecko shows over $66.7 million worth of BALD have been traded in the past 24 hours, while the transaction count has reached more than 14,000. BALD is listed on the DEX platform LeetSwap and trades in the BALD/WETH pair.

Wu Blockchain reported.

According to blockchain sleuth Lookonchain, BALD’s meteoric rise saw some savvy investors make huge returns. One such case involves four addresses that used 0.534 ETH (roughly $1k) to purchase 50 million BALD. The transactions occurred within minutes of Bald’s launch and accounted for 50% of the total supply.

Per Lookonchain, the addresses then quickly sold 37 million BALD to make an outsized return of 554 ETH, or over $1.04 million.

On-chain data also shows PEPE whale has bought 13.6 million BALD worth $937k – after they sold 720.8 billion PEPE for about $943k. The address is currently the largest holder of the token other than BALD’s developer.

The post BALD token records astounding 40,000% upside after launch on Base appeared first on CoinJournal.

Optimism bulls unfazed as network unlocks 24 million OP

  • Optimism (OP) price surged more than 7% on Sunday to reach intraday highs of $1.61.
  • the Ethereum layer-2 protocol unlocked 24 million OP tokens worth $38 million into circulation on July 30.
  • OP price could flip to $1.89 if bulls remain in control in the short term.

Optimism (OP) price surged more than 7% on Sunday to reach intraday highs of $1.61 as at 10:30 am ET. The gains put the Ethereum layer 2 protocol among the top performing crypto assets in the past 24 hours.

Daily trading volume is up 107% from a day ago, according to data from CoinGecko, with this coming even as the optimistic rollup network unlocked 24 million on July 30. 

Interestingly, on-chain data shows Optimism’s transaction volume recently surpassed that of other Ethereum L2 Arbitrum.

OP price prediction after token unlock

The release of more OP into circulation is part of the cryptocurrency’s scheduled unlocks. The latest saw 24 million OP worth $38 million added to circulating supply that currently stands at 679,080,066 OP. 

According to Token Unlocks, Optimism has another 45 token unlocks lined up. How does this unlock reflect in OP’s price?

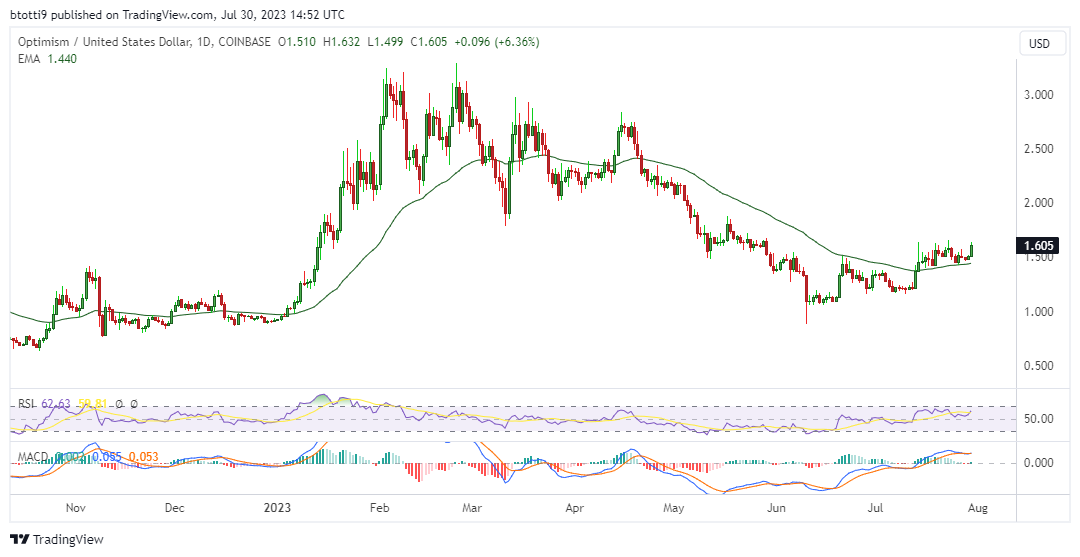
Optimism’s native token flipped green despite today’s token unlock. But prior to the surge, bearish pressure had seen it decline to lows of $1.44, the rejection having happened when OP/USD touched above $1.64 on July 24.

Meanwhile, the daily chart suggests that bulls have the upper hand with the Relative Strength Index (RSI) indicator rising and the Moving Average Divergence Convergence (MACD) signals potential bullish strength. 

OP price is also above the 50-day Exponential Moving Average (EMA), which has acted as support for the past two weeks. If price breaks above $1.64, the next target could be $1.89 and $2.00.

Optimism price chart. Source: TradingView

While the token unlock adds only 3.56% of total supply, it is notable that an increase in circulating supply often coincides with a dip in demand and price. As such, it is possible Optimism’s price could flip negative. 

If downside pressure resurfaces, OP price could rely on support at $1.44 and then $1.20.

The post Optimism bulls unfazed as network unlocks 24 million OP appeared first on CoinJournal.

ETH/USD price forecast as July comes to an end

  • Ethereum is consolidating around the yearly highs
  • $2,000 proves to be stiff resistance
  • ETH/USD price action holds between a $1,000 range since May 2022

There is only one trading day left in July, and the cryptocurrency market is consolidating. That is particularly true of major cryptocurrencies such as Bitcoin or Ethereum, as they both hover around their yearly highs against the US dollar. 

Ethereum found strong resistance at the $2,000 area in 2023, just as it found strong support at $1,000 last year. The question now is whether resistance holds and the price will be sent back to $1,000? Or will bulls manage to push over resistance, and the rally will continue in the last months of the year? 

ETH/USD remains bullish while the price holds above $1,000

The rally in the cryptocurrency market seen in 2023 triggered enthusiasm among cryptocurrency investors. However, without more follow-through, the bullish sentiment will dissipate soon. 

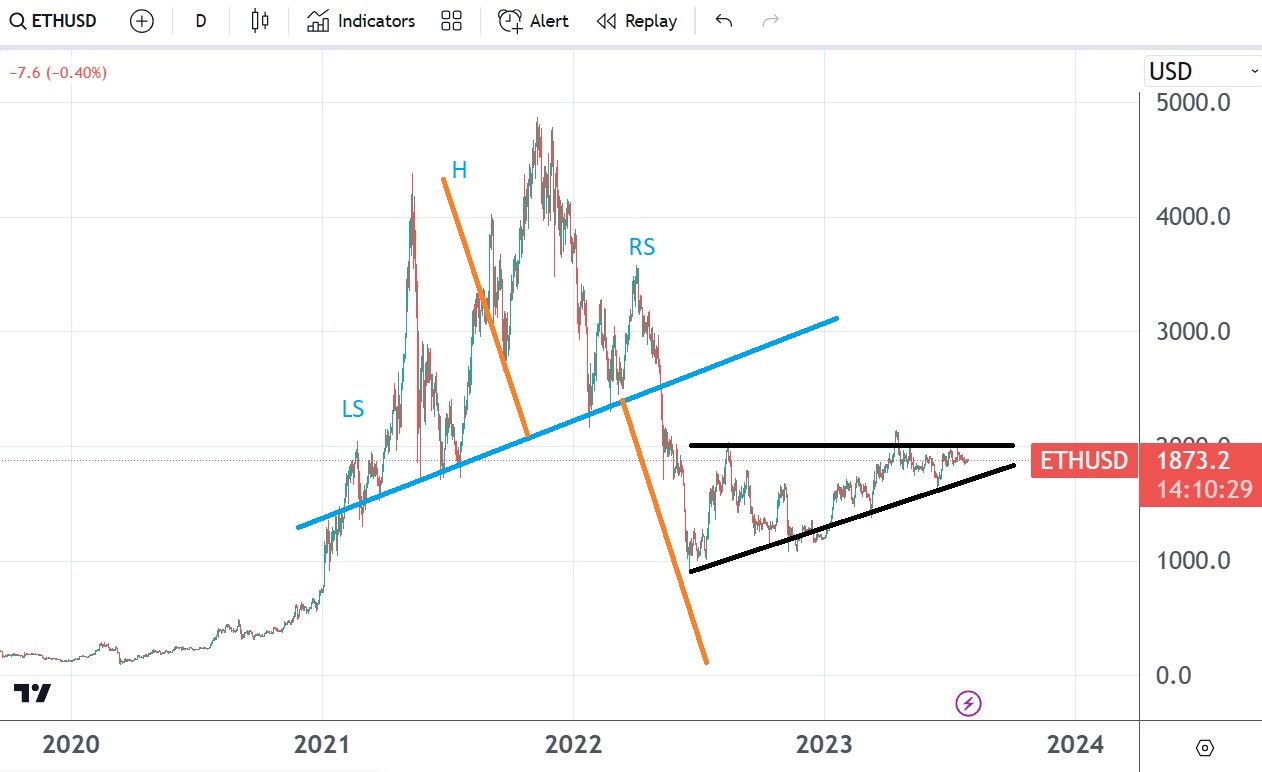
Ethereum chart by TradingView

A quick look at the chart above reveals a $1,000 range since May 2022. More precisely, the market moved between $1,000 and $2,000, clearly with an upside bias but failing to make a meaningful break higher. 

Since touching the $1,000 support level in 2022, ETH/USD started a series of higher highs and higher lows, typical in bullish formations. Because the higher lows formed against horizontal resistance, it looks like the market builds energy to break higher. However, the bullish bias should hold only if the price does not break the higher lows series. 

If it does, the focus suddenly turns to the $1,000. A clear break there brings back the previous head and shoulders pattern with a measured move much lower than $1,000. 

The post ETH/USD price forecast as July comes to an end appeared first on CoinJournal.

3 economic events to move the cryptocurrency market next week

  • Key US economic data is due this week
  • An increase in the US dollar’s volatility should move the cryptocurrency market too
  • The NFP report is the highlight of the week

The final week of July is ahead of us, and cryptocurrency traders might want to consider what happens with the US dollar. After all, Bitcoin’s consolidation around $30k in the past few weeks brought little or no activity in the market. 

Therefore, should the US dollar’s volatility rise in the week ahead, Bitcoin’s volatility may rise too. Consequently, the entire cryptocurrency market will be more active if Bitcoin’s volatility rises. 

So here are three events that might move the US dollar consider next week: 

  • ISM Manufacturing and Services PMI 
  • ADP Employment Change 
  • Non-Farm Payrolls

ISM Manufacturing and Services PMI

The PMI data is calculated monthly and interpreted in relation to the 50 level. A print bigger than 50 shows an expanding sector, while one above 50 shows an expanding sector. 

The United States is a service-based economy, so the services sector tends to have more weight for the US dollar. However, this week, the focus will be on the manufacturing data because it is forecast to come out below the 50 level. Any positive surprises should see the US dollar bouncing higher. 

ADP Employment Change

July’s ADP Employment Change or the private payroll numbers will be released on Wednesday. Market participants look at the private payrolls in anticipation of the all-important Non-Farm Payrolls report due two days later. 

This week, the market expects the US economy to have added 195k new jobs in July. Details matter because the ADP and NFP numbers often reflect the same thing. 

Non-Farm Payrolls

Because next Friday is the first Friday of the new month, the NFP report for the month of July is due. The market expects the US economy to have added 200k new jobs in July and the unemployment rate remained steady at 3.6%.

The post 3 economic events to move the cryptocurrency market next week appeared first on CoinJournal.