iZUMi Finance price: profit deals dump IZI after KuCoin listing

  • iZUMi Finance (IZI) price dropped over 15% amid massive profit taking.
  • The dump followed the token’s listing on major crypto exchange KuCoin.
  • But while price could fall below $0.030, the cryptocurrency’s strong ecosystem growth could see increased IZI demand and aid price uptick down the road.

iZUMi Finance (IZI) price fell more than 15% early Wednesday as the cryptocurrency’s market defied broader crypto prices outlook. IZI traded to lows of $0.032 as sell pressure mounted following the coin’s listing on major crypto currency exchange KuCoin.

The dump is likely a “sell the news” scenario as the price of iZUMi Finance rose exponentially over the past few days. This after KuCoin announced it would list the native token of the multi-chain decentralised finance (DeFi) protocol.

Even with today’s dip, IZI/USD was still trading more than 26% up in the past seven days and over 280% up in the past two weeks.

iZUMi Finance price: sellers in control for IZI/USD

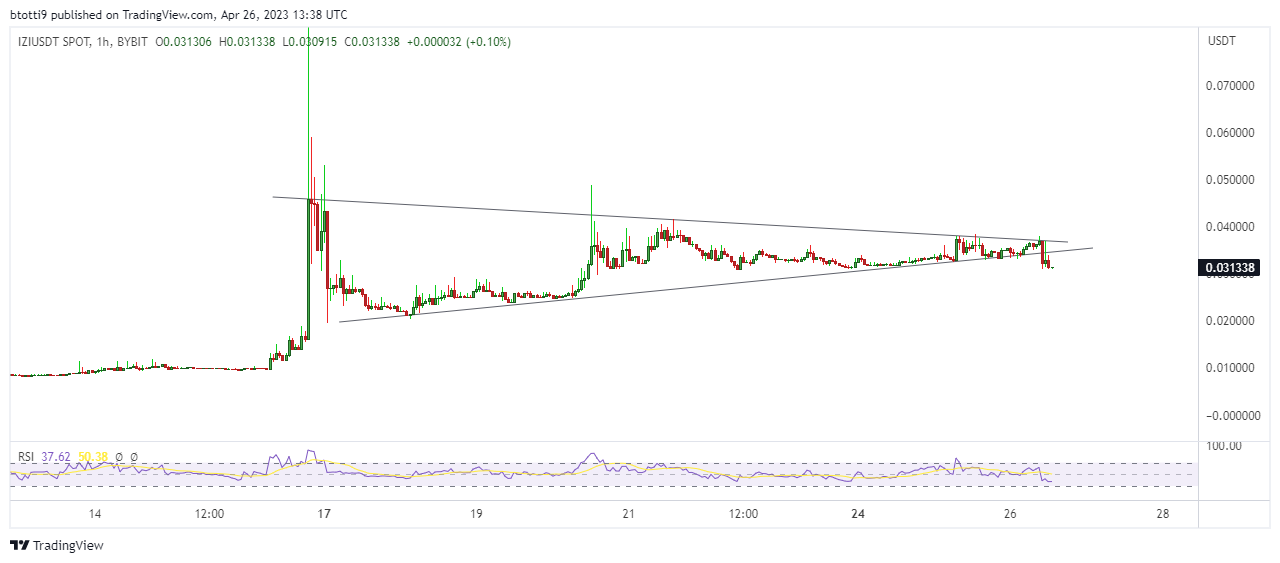
While current price outlook suggests sellers might push IZI lower, the cryptocurrency is poised at a horizontal demand zone that has helped bulls for much of April. That suggests the profit taking could give way to new upside momentum.

As for immediate price outlook, IZI/USD is likely to trade lower if bulls fail to keep $0.030. The hourly chart shows the token is trending towards the oversold territory though and could thus be due an upward flip should the $0.02 base hold. Otherwise, a dip to $0.011 could happen.

IZI price on the hourly chart. Source: TradingView

iZUMi Finance long term outlook: network strength key

A look at Izumi Finance’s network performance shows decent growth in total value locked (TVL). According to data on DeFiLlama, the TVL has risen sharply in the past 10 days – from under $2 million to over $25 million as of 26 April 2023.

The DeFi protocol’s products iZiSwap, LiquidBox and DAO veNFT among others are also seeing greater uptake across the market. Indeed, the platform announced on Wednesday that it had closed a $22 million financing round for the on-chain order book iZiSwap Pro.

The iZiSwap recently launched on zkSync Era, a future-proof zkEVM network helping to scale the Ethereum blockchain.

Other than the KuCoin, iZUMi has also struck key partnerships with MEXC Global, Bybit, Woo Network, and BitDAO. iZUMi also has a security partnership with auditing platform secure3io.

Building a strong platform amid the network pillars could inform long term demand for IZI and aid its price.

The post iZUMi Finance price: profit deals dump IZI after KuCoin listing appeared first on CoinJournal.

Band Protocol (BAND) and NEM (XEM) price prediction as Bitcoin bounces to $29k

  • Band Protocol (BAND) price was up 16% to $1.90 as major exchanges including Binance announced support for its network upgrade.
  • The uptick in cryptocurrency prices, with Bitcoin (BTC) price bouncing to $29,000, also saw NEM (XEM) price rise 4% to $0.04.
  • The price prediction for BAND and XEM is for a continued bullish flip, although buyers need to hold critical support levels.

Bitcoin (BTC) flipped higher from key support that has held over the past few days, with the bump to $29,000 providing a fresh bullish outlook for the cryptocurrency. With BTC price 6% up in the past 24 hours and crypto bouncing as new concerns hit the banking sector, a few altcoins look primed to make some decent moves.

Band Protocol (BAND) and NEM (XEM) are green today, but what’s their short term price outlook?

Band Protocol price prediction: BAND bullish above critical support level

The Band Protocol network upgrade is coming on 27 April 2023 and the native BAND token is surging. Major exchanges, including Binance are set to support the upgrade, and that has the community excited. But what’s the BAND price outlook? 

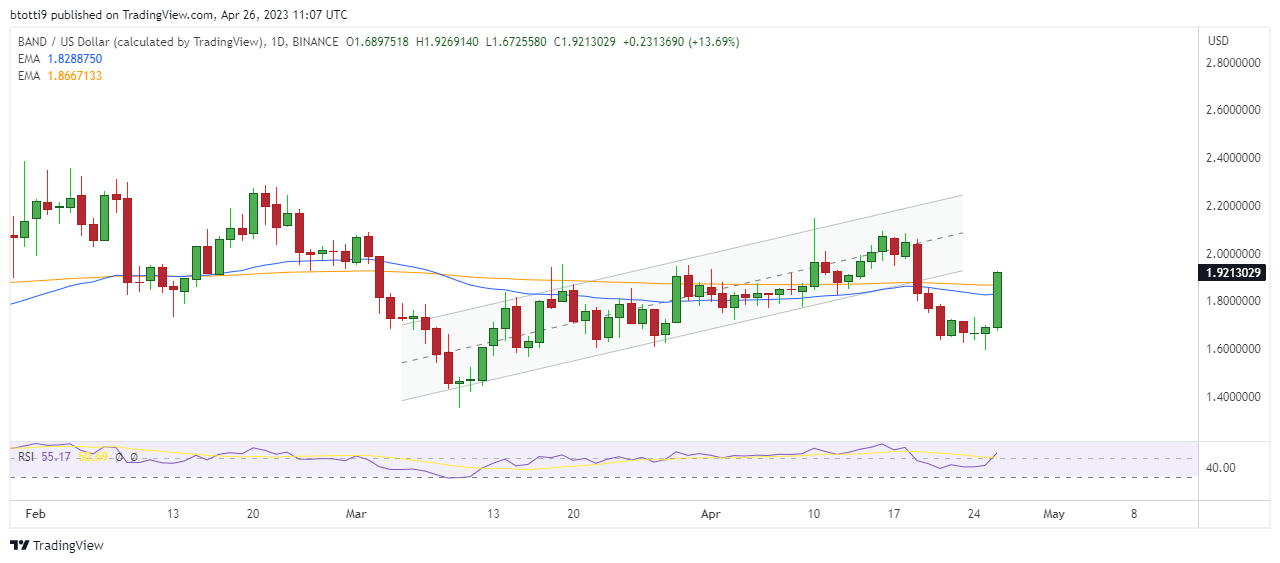
BAND/USD recently broke down from a rising parallel channel on the daily time frame to hit support around $1.65. Today’s double digit gains (BAND price is up 16% at the time of writing) has the coin trading above both the 50-day and 200-day exponential moving averages.

While the upside momentum is likely to push the price of Band Protocol higher, the key resistance zone is at the $2.0 psychological level. A bullish performance over the next few days could see buyers target $2.8.

On the downside, failure to consolidate gains above the $1.8 level could leave sellers eyeing $1.33.

Band Protocol price chart. Source: TradingView

NEM price prediction: can XEM break higher this time?

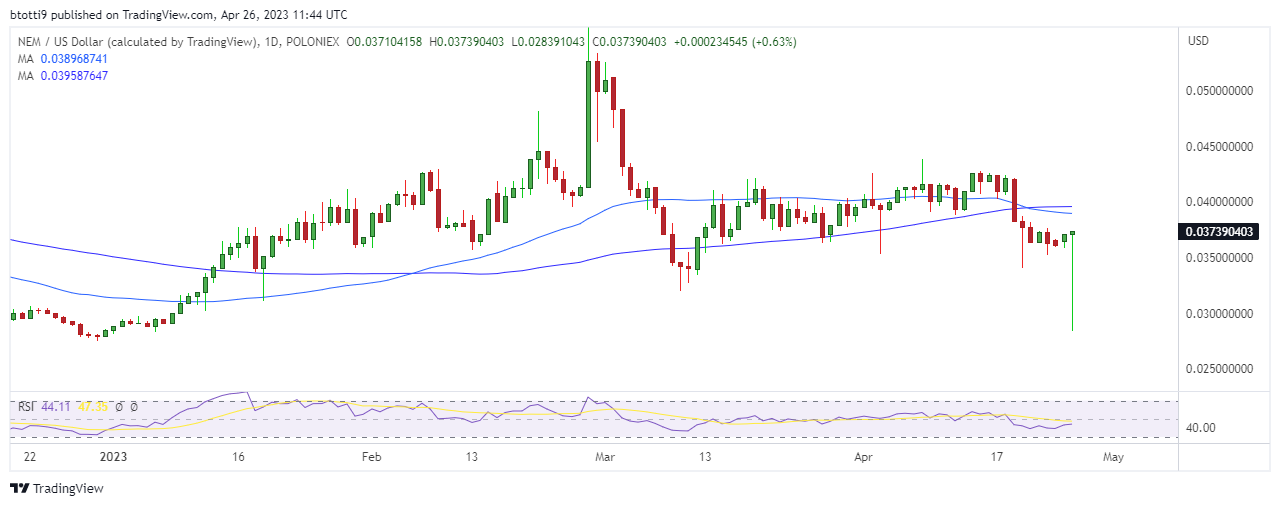
The XEM cryptocurrency has largely plateaued since its descent from highs of $0.77 reached in March 2021. Having corrected to lows of $0.028 in December 2022, XEM/USD flipped positive to hit $0.056 in February 2023.

The cryptocurrency retested the $0.028 support level again today, 26 April 2023. But bulls are battling to recoup gains amid the overall crypto bounce.

The coin currently trades near $0.04, with about 4% upside in the past 24 hours. But XEM remains negative on the week and in the past 30 days, trading 11% and 5% down respectively over these time frames.

XEM price outlook on the daily chart. Source: TradingView

A bearish crossover preceded the dip to the multi-month low and buyers have to reclaim $0.04 to extend today’s upside. Also, the daily RSI below the 50 line does not suggest much joy for bulls and a potential downward break to $0.033 and then $0.028 is a more likely short term scenario.

The post Band Protocol (BAND) and NEM (XEM) price prediction as Bitcoin bounces to $29k appeared first on CoinJournal.

Bitcoin supply is dwindling, yet volatility will be the biggest benefactor


Key Takeaways

  • Long-term holders are accumulating Bitcoin, with two-thirds of the supply stagnant for over a year
  • Our Head of Research, Dan Ashmore, writes that liquidity on the demand side is also drying up, with order books thin and stablecoins fleeing exchanges
  • This will kick up volatility in the short-term, leaving Bitcoin open to aggressive moves to both the upside and downside
  • Long-term the impact of a dwindling supply is a different discussion, but for now, risk is elevated in the already-risky crypto markets

A lot is made of the demand for Bitcoin. Are institutions giving up on it following a disastrous 2022 that saw the entire crypto sector go up in flames? Is the market moving back in now that interest rate forecasts have softened following the relentless rate hikes over the past year?

But rather than the demand, it is the supply of Bitcoin that is often the more intriguing to look at. Famously sporting a fixed cap of 21 million coins, Bitcoin’s supply schedule is coded into the underlying blockchain. This quality has given rise to a million different theories around the future place – and price – of Bitcoin in the world. 

But there is another interesting analytical angle to Bitcoin: before the anonymous Satoshi Nakamoto launched Bitcoin in 2009, the world never had an asset that provided so much visibility over the supply distribution. The nature of the blockchain is that, while the individual holders are anonymous, the distribution of all coins is available for the world to see at all times. So, let’s have a look. 

Long-term holders are accumulating Bitcoin

Central to many Bitcoin bulls’ long-term thesis is the idea that long-term holders will suck up supply, leading to an inexorable price rise. 

Looking at current holdings, two-thirds of the supply has not moved in a year. That is certainly a large number, and we will get into what that means in the next paragraph. Pushing the timeline further out, over half the supply (53.6%) has been stagnant for over two years, 39.7% has not moved in 3+ years, and 28.6% has been idle for 5 years or longer. 

What does this mean for price?

These are large numbers by any stretch. It is impossible to compare them to other asset classes, given that none are trackable on a ledger like the blockchain. Perhaps only commodities such as precious metals can compete with the above numbers, yet that is only speculation. 

But what does it mean? Is this a bullish sign? Well, yes and no. The immediate conclusion is that less supply means less demand is needed to push the price up, and the cap at 21 million Bitcoins certainly means if that demand keeps rising, the price has nowhere to go but up. 

However, there are mitigating factors here. The first is the reality that some of the above “long-term holders” are in fact just lost coins, be it through people who have passed away, forgotten about their coins or lost access to their wallets. 

Bitcoin creator Satoshi Nakamoto is one of those, the mysterious enigma holding approximately 1.1 million bitcoins, equivalent to a mammoth 5.2% of the supply. None of his/her/their coins have moved since they were mined back in the first eighteen months of Bitcoin’s existence. 

Not to get too tangential, but below is the value of Nakamoto’s holdings over the last 13 years, assuming a stash of 1.1 million Bitcoin from mid-2010. That is a lot of capital that holders must surely hope never floods the market. 

Volatility to rise with less liquidity 

Regarding the impact of these large stashes of Bitcoin which are “removed” from circulation, the greatest impact – for now, at least – may be on the volatility rather than price. 

In the following chart, I have plotted the amount of Bitcoin sitting on exchanges, currently at a 5-year low. 

Not only is the amount of Bitcoin on exchanges dwindling, but stablecoins are doing the same. Over half of the balance of stablecoins have flooded out of exchanges since December. 


This means liquidity on both the demand and supply side of Bitcoin is thin – and the same conclusion will be reached if an order book is downloaded from an exchange. Liquidity has dried up hugely, especially since FTX went under in November.

This lack of liquidity only serves to jack up the already sky-high volatility in the Bitcoin market, exacerbating moves to both the upside and the downside. This is part of the reason why volatility recently spiked to its highest level since mid-2022, and also a factor in Bitcoin’s massive run-up this year. 

By definition, it takes less to move a thin market, and with forecasts around the future path of monetary policy shifting to a more optimistic stance in recent months, Bitcoin has moved up with minimal resistance in its path. 

While the supply-side dry-up is intriguing in the long-term, looking into that with regard to Bitcoin’s future performance is a different discussion entirely.  In the short-term, capital has fled crypto markets at an unprecedented pace, and we are now in a spot where the market is primed for violent moves in either direction. Like always in crypto, the short-term is difficult to predict, however, and the risk remains extreme – perhaps even more so currently than normal.

The post Bitcoin supply is dwindling, yet volatility will be the biggest benefactor appeared first on CoinJournal.
Why is the Render Token (RNDR) price surging?

  • Render Network’s token jumped sharply on Wednesday.

  • The community passed two key votes: RNP – 002 and RNP – 003. 

Render Token (RNDR) price surged to a key resistance level after the developers made a major milestone. The token surged to a high of $2.20, which was the highest point this month. In all, the token has been one of the best-performing cryptocurrencies after rising by more than 140% from the lowest level in March.

Render Network news

The main reason why the RNDR price surged is that the community completed the RNP-002 and RNP-003 votes. These were the most important votes in the community because they will change the architecture of the network.

Precisely, RNP-002 means that Render Foundation can now move ahead with implementing the BME model on the Solana ecosystem. Solana is a leading blockchain that is known for its fast speeds and low transaction costs. 

Unlike Ethereum, Solana can handle thousands of transactions per second while the average cost is less than $0.01. Therefore, by using Solana, Render hopes that its users will work at a faster pace and save a lot of money in transaction costs.

Meanwhile, the RNP-003 vote was known as the Resource Acquisition and Allocation for Core Team and Grants. The vote simply makes it possible for the Render Foundation to acquire and allocate resources in a bid to grow the ecosystem. The next stage is that these votes will be updated to Approved and on the Roadmap. 

Render Token price prediction

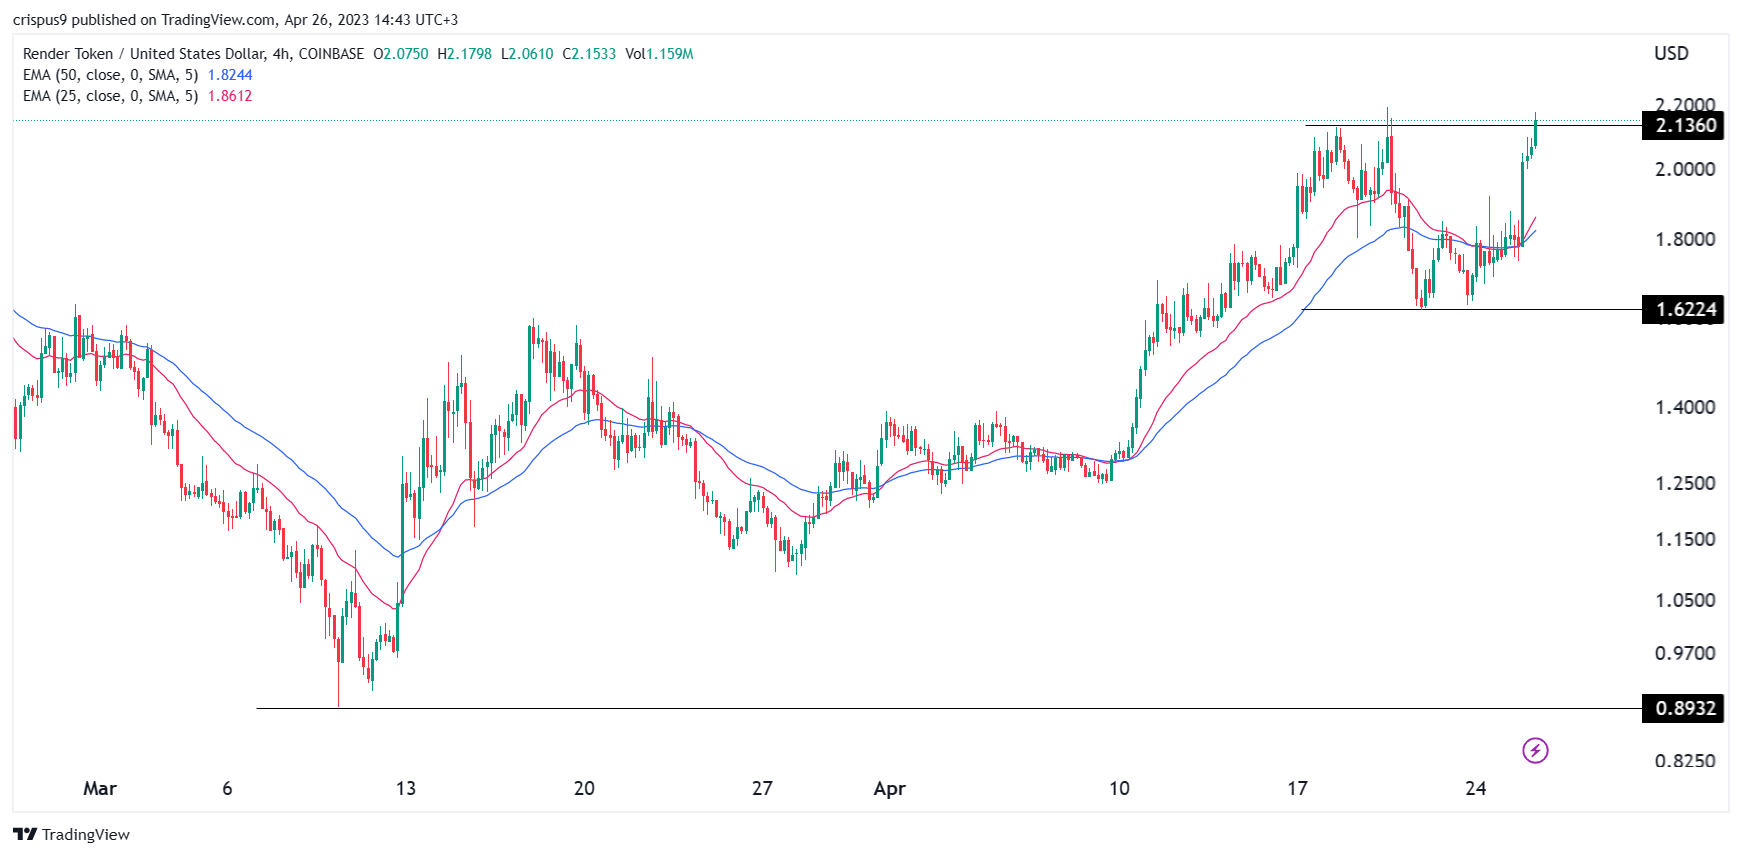
The daily chart shows that the RNDR price has been in a strong bullish trend in the past few months. It has jumped from a low of $0.8932 in March to a high of $2.20. The token has jumped above all moving averages.

The current price means that the token has formed a double-top pattern. In price action analysis, this pattern is usually a bearish sign. Therefore, with the Solana integration news confirmed, there is a likelihood that the token will pull back.

This is known as buying the rumours and selling the news. It happens when investors buy an asset ahead of a major event and then sell when it happens. If this happens, the next key level to watch will be the neckline of the double-top at $1.622.

How to buy Render Network token

The post Why is the Render Token (RNDR) price surging? appeared first on CoinJournal.