Is ApeCoin a buy after retesting $4.3 support?

  • ApeCoin finds support at the $4.3 price level.
  • APE is down 83.8% from its all-time high.

  • Trends around Metaverse directly affect the long-term value.

The ApeCoin DAO airdropped millions of APE tokens to NFT owners in March this year during the token’s launch. The airdrop went to BAYC, Mutant Ape Yacht Club, and Bored Ape Kennel Club NFT holders. The token distribution and the speculations around it drove it to as high as $27 in April.

The surge was also attributed to the anticipated NFT sales of the BAYC metaverse game ‘Otherside’. However, at the moment, the enthusiasm seems to have faded away. APE is currently trading at $4.28 after a 5.77% decline in the past day and a 10.39% drop in the past week.

Overall, ApeCoin is down 83.8%, with a market capitalization of $1.29 million and #43 in market ranking. The current circulating supply is 299,531,250 from a hard cap of 1 billion. 

ApeCoin is a governance token that is used as a utility token. The token allows holders to be part of a decentralized ecosystem of a Web3 community. The native APE token started trading on March 17, 2022. The token remains bearish despite attracting notable partnerships from major industry players like Animoca Brands. However, as the Web3 economy evolves into the metaverse, projections point to a comeback in the token.

APE retests $4.3 support

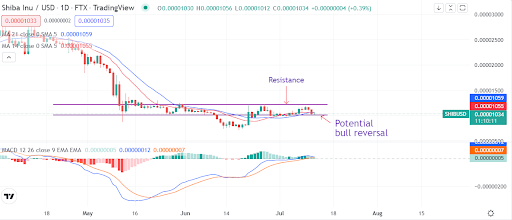
The 4-hour technical chart below shows that APE has retested the $4.3 price support. The MACD line has crossed the signal line from above to below, showing that the momentum is bearish. However, the RSI reading is at the oversold zone and presents a potential trend reversal. If the trend reverses, $5.3 will be the next level to watch. Clearance above the resistance could welcome an uptrend.
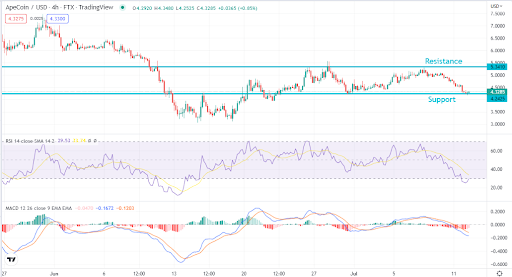
Source: TradingView

Summary

While the speculation around NFTs is believed to have been behind the surge in the value of APE, the long-term value seems intact. The technical indicators show mixed signals, with the MACD showing bearish momentum while the RSI seems to have bottomed. For the holders, the trends in the metaverse and NFTs will inform the value of ApeCoin.

The post Is ApeCoin a buy after retesting $4.3 support? appeared first on CoinJournal.

What next as Tezos slips below a short-term trendline?

  • Tezos token XTZ has been bullish this month.

  • The cryptocurrency has breached an ascending trendline and is going lower.

  • XTZ could fall up to $1.3 as weakness develops.

Tezos XTZ/USD has been bullish since the start of July. The cryptocurrency recovered from the $1.3 bottom on July 1, rising to a high of 1.7 on July 11. The crypto weakness has caused a 2% drop in Tezos in the last 24 hours.

Tezos prides itself on being an open-source platform. It seeks to address the barriers that face blockchain adoption for assets and applications. It achieves the goal by ensuring that Web3 is user-governed. Users can directly interface with one another over the network and interact with various applications. Its native token XTZ is used to pay for fees and for staking. It also acts as the basic accounting unit on the blockchain platform.

Whereas the XTZ token surged massively in 2021, it crashed this year. The token currently trades at $1.5, significantly below the high of above $9 in October 2021. Investors could again be looking for an opportunity to snap the token at the bottom. But is Tezos currently a buy?

Tezos bearish breakout is currently underway

Source – TradingView

Technically, the MACD indicator is flashing a bearish market for Tezos. Previously, the cryptocurrency was trading in a system of higher highs and higher lows. Prices always recovered after hitting the 21-day moving average. However, with the recent weakness, Tezos broke below the ascending trendline and channel. It also trades below the 14-day and 21-day moving averages, which affirms the developing bearish move. We recommend a sell of Tezos as the price faces further declines. The cryptocurrency could proceed lower to touch the $1.3 support again.

Summary

Tezos is bearish after breaching an ascending trendline and channel. MACD indicators and moving averages are bearish. The cryptocurrency could fall back to $1.3.

The post What next as Tezos slips below a short-term trendline? appeared first on CoinJournal.

Shiba Inu price prediction as the number of investors grows by 21,000

  • Shiba Inu investors have increased by more than 21,000 in a month.
  • SHIB is currently consolidating with a potential breakout.

  • Investors can buy now to lock value, although further declines are possible.

As of July 11, the number of investors holding Shiba Inu SHIB/USD was 1,199,539. The number is a jump from 1,178,157 as of June 12, according to data by CoinMarketCap. The monthly jump in SHIB investors happens despite the current crypto bear sentiment. 

The growth in investors also comes along with a rising utility of Shiba Inu. Shiba Inu is slowly relinquishing its meme tag by innovating in the payments and metaverse areas. The network plans for a Shiba Inu metaverse, where users can play games and own virtual lands. No specific date is given for the launch of the metaverse, although it is expected this year. Investors are positioning themselves for a potential increase in the utility of Shiba Inu. 

The increase in investors holding SHIB may not accurately predict a price jump. However, it suggests that investors are expecting the price to pump following the recent declines. We believe that SHIB presents a short-term opportunity. The crypto-token could pump once a key breakout occurs.

Shiba Inu holds onto support as the number of investors rise

Source – TradingView

From the daily chart, Shiba Inu is consolidating. The MACD indicator is slightly bullish. The token keeps $0.00001 support intact. SHIB investors should watch for a breakout from the $0.00001 to the $0.000012 consolidation zone. Short-term focused investors can buy the bottom at $0,00001 and ride up to $0.000012. However, the price jump is speculative, and the price could drop below the support. A long-term buy is recommended at the current level. Alternatively, investors should consider buying after a break above the $0.000012 resistance. 

Summary

Shiba Inu is consolidating as more investors add positions. The price could rise from the $0.00001 level. The token faces resistance at $0.000012.

The post Shiba Inu price prediction as the number of investors grows by 21,000 appeared first on CoinJournal.

Sandbox token rejected at $1.3. What next as the price dips again?

  • Sandbox’s SAND was resisted at the $1.3 level.

  • The price is currently bearish but could be contained by the $0.9 support.

  • Investors should watch for a potential breakout.

$1.3 remains a key level to watch for Sandbox’s native token SAND/USD. The metaverse token showed renewed hopes last month after jumping from a bottom of $0.75. At the current trading of $1.1, SAND is recovering, although an immediate resistance holds it back.

Metaverse tokens such as SAND boomed last year at the back of the growth of virtual reality blockchains. This year, activity has slowed, although firms are still showing interest.

Citi strategists believe the metaverse economy is $8 trillion to $13 trillion in addressable value. With such huge potential, metaverse tokens such as SAND remain viable for keen investors. However, the recent bearish crypto sentiment has been a hit for SAND. The weakness should not concern a keen investor looking for long-term gains. In the short-term, SAND eyes a breakout that investors should monitor.

SAND trapped below $1.3 resistance and $0.9 support

Source – TradingView

Technically, SAND has been consolidating since May. The token’s established resistance is at $1.3, while the support is at $0.9. The price of the metaverse token has oscillated between these two regions for around 2 months. The level is a critical make-or-break zone for SAND as the cryptocurrency resists going lower. 

The MACD indicator is showing a bearish signal. The line is about to cross below the moving average to confirm the bear move. The level reflects the current correction after the cryptocurrency was resisted at $1.3. The short-term 14-day and 21-day moving averages are also above price. The current sentiment on SAND is bearish. Nonetheless, the correction could end once $0.9 support is reached.

Summary

Sandbox’s SAND is technically strong above $0.9 support. The $1.3 resistance holds the price back. A potential break above the $1.3 resistance would usher a fresh bullish momentum.

The post Sandbox token rejected at $1.3. What next as the price dips again? appeared first on CoinJournal.