YFI price prediction: Yearn Finance could sink by 30%

YFI price rose for five straight days as investors bought the dip in DeFi cryptocurrencies. Yearn Finance rose to $11,350, which was the highest point since May 12th of this year. It has jumped by about 172% from the lowest level this month, bringing its total market cap to over $358 million.

Yearn Finance recovery

Yearn Finance is one of the oldest blockchain projects in the decentralized finance (DeFi) industry. It was established by Andre Cronje, a leading player in the industry. Cronje is also credited for creating platforms like Wonderland and Abracadabra.

The platform simply enables people to earn returns from their cryptocurrencies. At its peak, Yearn had a total value locked (TVL) of over $6 billion, making it one of the biggest platforms.

Recently, however, the platform has lost steam as the number of people using it to grow their wealth has fallen. According to DeFi Llama, Yearn Finance has a TVL of about $660 million. It has been overtaken by other platforms like Lido, Maker, and Compound. Yearn is built on top of Ethereum, Arbitrum, and Fantom blockchains.

Yearn Finance was created to be the Amazon of the blockchain industry. After depositing funds in its platform, it scours the market to identify the best returns in other protocols like Aave, Curve, and Compound. As such, users can optimize their returns in just a few steps. 

The YFI price is rising as investors predict that there will be more demand for DeFi tokens now that the industry has weathered this year’s crisis. Indeed, many DeFi platforms have been left unscathed even as other centralized platforms like Voyager Digital and Celsius filed for bankruptcy.

YFI price prediction
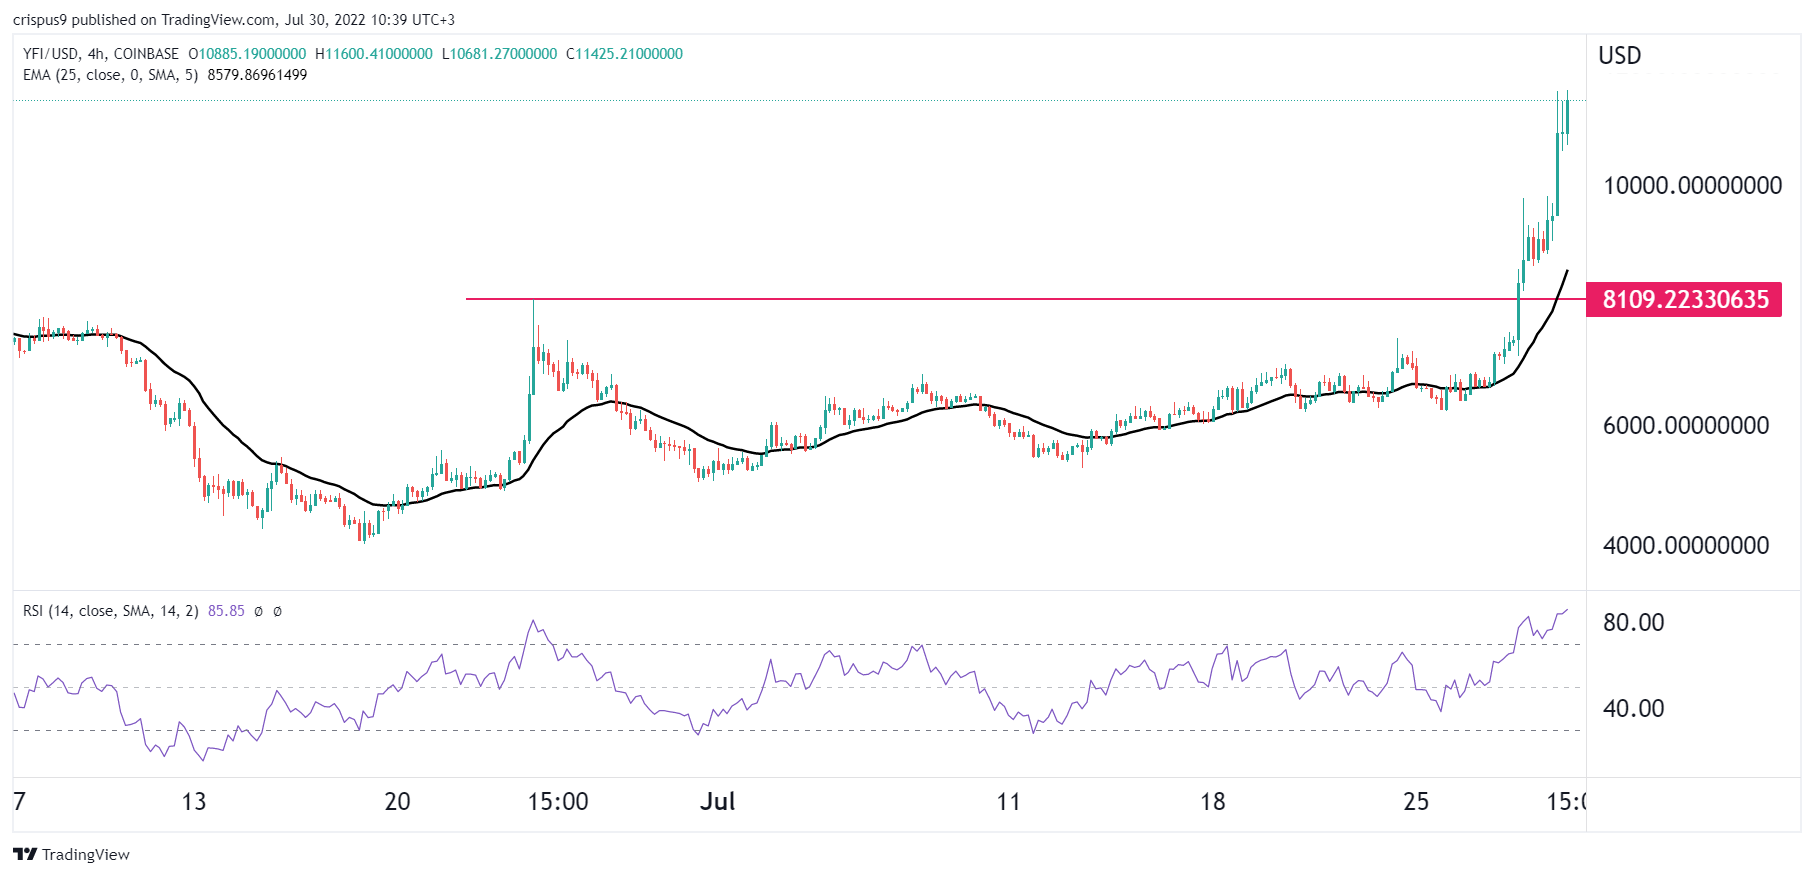
The four-hour chart shows that the Yearn Finance price has been in a strong bullish trend in the past few days. It has risen above the important resistance level at $8,100, which was the highest point on June 24th. Yearn has rallied above the 25-day and 50-day moving averages while the Relative Strength Index (RSI) has moved above the overbought level.

Still, with the coin extremely overbought, there is a likelihood that its price will pull back in the next few trading sessions. If this happens, it will retest the support at $8,109, which is about 30% below the current level.

The post YFI price prediction: Yearn Finance could sink by 30% appeared first on CoinJournal.

Tron price prediction as Unifi Protocol TVL explodes

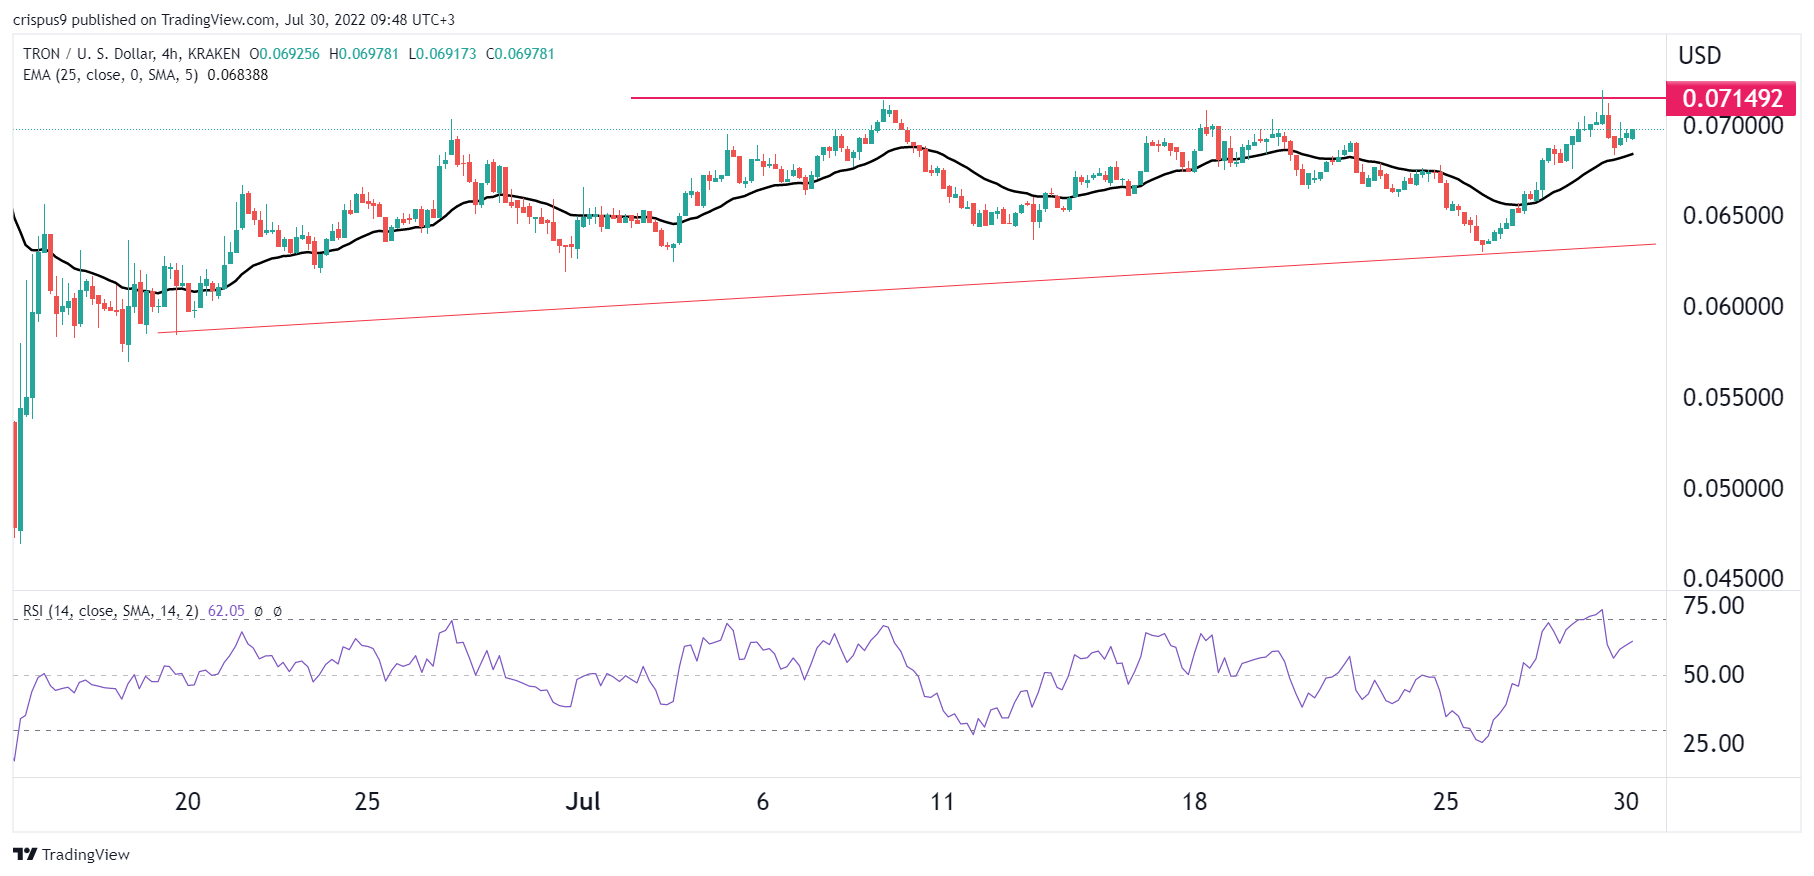
Tron price has held steady on Saturday as investors focus on the ongoing crypto recovery and the gains made by UNIFI. The TRX token rose to $0.70, which is about 50% above the lowest level this year. Its market cap has jumped to over $6.4 billion, making it the 17th biggest cryptocurrency in the world.

Unifi Protocol and USDD growth

The TRX price has jumped sharply in the past few weeks as cryptocurrencies rebound. Indeed, most coins like Ethereum, Bitcoin, and XRP have all gained recently, with the total market cap of all digital coins soaring to over $1.1 trillion.

Tron has also risen because of the substantial gains made by USDD, the stablecoin that was launched in May this year. USDD is an overcollateralized algorithmic coin that it hopes will become a leading player in the crypto industry. 

Still, there are concerns about the little growth of the coin. After moving from $0 and seeing strong inflows, its market cap has been stuck at $725 million. This is a sign that demand for the coin may have peaked.

For one, investors are scared about its future since the coin is algorithmic in nature and is backed by risky cryptocurrencies like TRX and Bitcoin.

Tron price has jumped because of its expanding DeFi universe. For example, according to DeFi Llama, the total value locked (TVL) in Tron has jumped to over $5.88 billion, making it the third biggest platform after Ethereum and BNB.

Most of this growth has been driven by Unifi Protocol. The total value locked in Unifi has jumped by 581% in the past 30 days to $1.5 million. This is notable since this is a small platform that is gaining traction. Unifi is a platform that offers several products like uTrade, uStake, bridge, and Unifi Bridge.

Tron price prediction

The four-hour chart shows that the TRX price has been in a strong bullish trend in the past few days. It has remained above the ascending trendline shown in red. At the same time, it has moved slightly above the 25-day moving average while the Relative Strength Index (RSI) has moved slightly below the overbought point at 70. 

Therefore, there is a likelihood that Tron price will continue rising in August as demand for the coin rises. If this happens, the next key resistance level to watch will be at $0.80.

The post Tron price prediction as Unifi Protocol TVL explodes appeared first on CoinJournal.

FDIC says deposit insurance does not apply to crypto

The FDIC says the public should note that deposit insurance does not cover non-bank entities and non-deposit products, including stocks and cryptocurrencies.

The Federal Deposit Insurance Corp (FDIC), an independent US agency that insures deposits and helps protect customers in case of given bank failures, has released a clarification message for crypto investors concerning its mandate.

In a fact sheet released on Friday about the FDIC deposit insurance and crypto companies, the agency warns the public that claims crypto deposits being insured are inaccurate.

Per the agency, some cryptocurrency platforms have “misrepresented” information concerning crypto products and their eligibility for FDIC deposit protection.

These sorts of statements are inaccurate and can cause consumer confusion about deposit insurance and harm consumers under certain circumstances,” the Fact Sheet noted, making it clear that crypto isn’t FDIC-insured. Specifically, the deposit protection doesn’t cover failed non–bank entities, such as crypto companies.

The Fact Sheet also states that “deposit insurance does not protect consumers with non–deposit products such as stocks, bonds, mutual funds, securities, commodities, or crypto assets.”

Non-bank deposits and an insured bank’s products

An FDIC advisory also sought to clarify that while it offers depositor protection to insured banks’ customers, the same does not extend to a non-bank entity or the customers even if the entity offers products via a depository-insured bank.

In dealings with crypto companies, FDIC-insured banks should confirm and monitor that these companies do not misrepresent the availability of deposit insurance,” read the advisory.

The FDIC’s message to the public follows developments with the bankrupt crypto lender Voyager Digital.

The crypto company, which had some customer deposits with an FDIC-insured bank (the Metropolitan Commercial Bank) has been asked not to misrepresent facts about deposit insurance to its customers.

The post FDIC says deposit insurance does not apply to crypto appeared first on CoinJournal.

The Graph token has a 23% potential from the current bullish momentum

momentum

  • The Graph is an indexing protocol for querying other networks

  • The Graph token GRT surged by 19.44% in 24 hours

  • The token could rise to $0.16, and a potential retracement at $0.13 offers a change for entry.

The Graph GRT/USD may not be the most talked about cryptocurrency. However, the network solves a critical blockchain problem.

The Graph refers to itself as an indexing protocol for querying other networks such as Ethereum. Before the Graph, developers had to come up and run proprietary indexing servers. The process was resource intensive while undermining the security features required in decentralization.

Ranked at position 55 by market cap, The Graph has been making slow but sure gains. Our attention is drawn to 24-hour gains of 19.44%. The gains coincide with an accelerated trading volume which surged by 82%. Investors looking for an alternative to the top major coins should consider The Graph. 

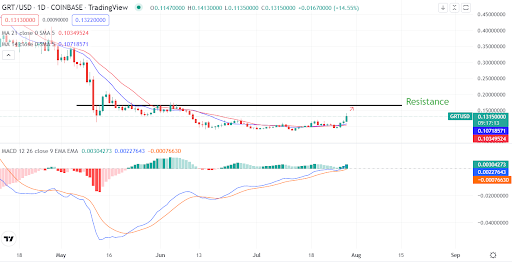
The Graph maintains an uptrend with potential resistance at $0.13

Source – TradingView

Technically, MACD and moving averages are bullish on The Graph token. The cryptocurrency is aiming for the $0.16 resistance, the established resistance. This is after overcoming the bottom price of below $0.10. At the current price of $0.13, the target represents an upside potential of 23%.

Nonetheless, before the token rises to $0.16, it could meet a minor resistance at the $0.13 level. The token is already sliding after hitting the zone. Any potential correction could see The Graph token settle at $0.117. That would open buy trades at a lower level.

Summary

The Graph token is pushing higher as the general crypto sentiment improves. We set our target at $0.16, the main resistance after the token escaped the $0.10 bottom. The price faces some resistance at $0.13. Investors should consider buying on a retracement, potentially at $0.117.

The post The Graph token has a 23% potential from the current bullish momentum appeared first on CoinJournal.

Consider buying Bitcoin Cash on a retracement as price pumps

  • Bitcoin Cash is among the top gainers with 24% weekly upside

  • BCH is facing potential retracement at the current level  

  • Investors should consider a buy above $120

Cryptocurrencies have recorded a significant recovery following a rate hike by the Federal Reserve. Fears of an imminent recession have also ignited a bullish sentiment. With crypto often seen as a hedge against inflation, some are reaping big. One such token is Bitcoin Cash BCH/USD.

Bitcoin Cash was forked from Bitcoin with the promise of a bigger block size and faster transactions. Seen as a more efficient alternative to bitcoin, Bitcoin Cash is living up to the very promise. Its native token has jumped 8.29% in the past day, bringing weekly gains to 24%. Comparatively, Bitcoin has pumped a miniscule 4% in the past 24 hours and 2.44% in the last week..

Zooming out further, despite the closer correlation between Bitcoin and Bitcoin Cash, the latter is showing a stronger recovery. Bitcoin Cash is up 53%, while Bitcoin has surged 16% in the past month. Of course, this is taking into consideration a $450 billion market cap difference between the two tokens. 

Nonetheless, Bitcoin Cash remains susceptible to the factors affecting the original blockchain. Both tokens are down 64% and 87%, respectively, from the highs of last year. Aside from the correlation, Bitcoin Cash is showing some positive developments from the technical outlook.

BCH Faces retracement amid a strong bullish momentum

Source: TradingView

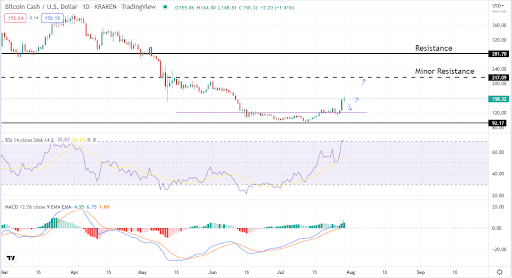
BCH is on a strong bullish momentum, currently trading at $158. The MACD has crossed from below to above the signal line. If the momentum continues, the focus will shift to the $217, which is minor resistance. Further, $281 is the other important level that investors should keep an eye on. On the flip side, BCH could be preparing for a retracement.

The RSI indicator is at the overbought zone, a level that was last seen in March. If this is the case, $120 becomes the immediate fallback for Bitcoin Cash. If the level does not hold, the token can slide further to $92.

Concluding thoughts

BCH is not a buy at the current level. The token could be preparing for a short-term retracement. Investors should watch $120 as a potential entry point and take advantage of the next bull run. 

The post Consider buying Bitcoin Cash on a retracement as price pumps appeared first on CoinJournal.