Is it time to sell Ethereum despite the recent rally?

Ethereum has rallied by nearly 40% in 10 days. The coin is now firmly above $1000. It has also surpassed the $1300 resistance as investors rush in to buy the July crypto dip. However, technical indicators suggest that ETH has lost momentum. The coin is now facing a steep sell-off. Here are some key takeaways:

  • Momentum indicators on the chart show ETH is now overbought.

  • The coin is struggling to hold above its 50-day moving average of $1300.

  • A correction of around 20% is plausible over the next few days.

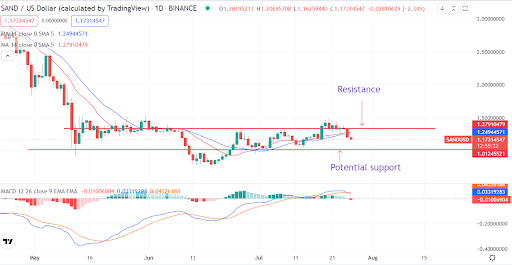
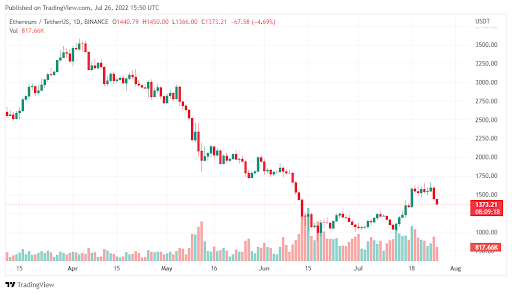
Data Source: TradingView 

Ethereum Price Analysis and Prediction

Between July 15th and July 25th, ETH charted a strong upward trend. The coin was up 40% during this period as the broader market recovered from July lows. But this strong momentum has now slowed. ETH has retreated sharply and is now hovering above its 50-day moving average of $1300. A drop below $1300 will likely trigger a steep sell-off that ultimately sends ETH to $1180.

Despite this, analysis of previous ETH trading history shows strong demand at $1550. In fact, nearly 586,000 unique addresses have purchased 5.1 million coins at the $1550 mark. If ETH reverses the current downtrend and rallies to $1550, our bearish outlook becomes invalidated.

However, this will not be easy. For instance, ETH is overbought. This leaves minimal space for a strong uptrend. The Tom DeMark (TD) Sequential indicator is also flashing the ‘sell’ signal. All these factors strongly affirm our prediction that a sharp ETH sell-off is highly probable.

Will ETH rise again in the near term?

For now, the best-case scenario is for ETH to hold above the 50-day MA at $1300. If this happens, we may see a period of sideways trading as the coin tries to generate demand.

However, the more likely outcome is that ETH will end July in the red. The coin might even fall below $1000 over the next 14 days.

The post Is it time to sell Ethereum despite the recent rally? appeared first on CoinJournal.

Watch for the close of Avalanche’s daily candlestick to assess price direction

  • Avalanche is trading at the breakout zone after correcting in a bear market

  • The Fed’s policy move on Wednesday will determine the price move

  • Watch for the close of the daily candlestick for a possible reversal or bear continuation

Most cryptocurrencies are correcting after the recent gains. Profit taking and Fed’s policy action on Wednesday is playing a role. Cryptocurrencies like Avalanche AVAX/USD had previously breached key levels. They remain on the watch list should the Fed hold a soft stance regarding policy tightening.

AVAX is trading at $20.12. The level is close to or at the support of $20.95. AVAX traded and consolidated at $26 as the price pushed through the $20.95 resistance. At the current price, the token is seemingly looking to crash back into the consolidation zone. Nonetheless, it can’t be confirmed yet that AVAX has slipped below the $20.95 support. We need the close of the daily candlestick for confirmation.

AVAX slightly slips below the breakout support

Source – TradingView

Technically, the Avalanche token is bearish at or slightly below the $20.95 support. The short-term moving averages have moved above price and could add bear weakness. The MACD indicator is also about to close below the moving average in a bear market.

While bear pressure remains on AVAX, we cannot confirm a break below the $20.95. Investors should watch for the close of the daily candlestick. It could be a false breakout if the candlestick closes above the support. In that case, a buy signal would be generated. That would, of course, be subject to the prevailing crypto sentiment.

If AVAX closes below the $20.95 support, with a bear crypto sentiment, weakness will continue. The next potential support for the token is $16.

Summary

AVAX is yet to confirm a bearish momentum despite breaking slightly below the $20.95 support. The token could reverse if the daily candlestick closes above the support.

The post Watch for the close of Avalanche’s daily candlestick to assess price direction appeared first on CoinJournal.

Shiba Inu is vulnerable close to support as interest in token wanes

  • Shiba Inu is experiencing declining Google search interest as price slips

  • The token remains the most held by Ethereum whales

  • SHIB will continue to drop in the bear market, but the price could find support soon

Shiba Inu SHIB/USD price has largely been influenced by retail interest and social media frenzy. That’s why a drop in interest has an adverse impact on price. Accordingly, “Shiba Inu” Google Search queries are at the lowest in more than a year in July. The drop in interest is reflected in the price, although the developing crypto weakness is also a cause. 

As press time, SHIB was down 7.82% in the last 24 hours. The decline takes the total losses in the week to nearly 10%. However, it should be remembered that SHIB has been on an upward momentum since mid-June. 

Whalestat data also indicates that SHIB remains the most held token, after ETH, by Ethereum whales. That signals the expectation of a price jump in the future. Thus, the drop in search interest may not accurately reflect price but can cause a short-term weakness.

Shiba Inu nears support as the price weakens

Source – TradingView

We believe $0.0000104 is the level to watch for SHIB investors. The level is a make-or-break zone as it is the support that marks the bottom of the consolidation zone. The MACD line is crossing below the moving average, indicating a further bear pressure. The moving averages have also joined the resistance. If SHIB breaks below the support, it could fall to $0.0000077. 

Concluding thoughts

Shiba Inu is witnessing a decline in Google search interest, but whale holdings are still strong. The token is trading lower and nearing the $0.0000104 support. SHIB needs to overcome a drop below the support to remain in the consolidation zone.

The post Shiba Inu is vulnerable close to support as interest in token wanes appeared first on CoinJournal.

Uniswap price prediction amid full NFT integration plans

  • Uniswap has hinted at plans for a Full Sudoswap Support

  • Uniswap token is under pressure but remains in an uptrend

  • $5.6 is the immediate level to watch should weakness continue

Uniswap UNI/USD is correcting after the recent gains that saw the token top $7.70 on July 19. The token has been largely consolidating since July 16. A breakout of the key levels seems unlikely as weaknesses continue to grow. 

The latest weakness in the Uniswap token comes amid positive developments on the network. On June 22, Uniswap’s head of NFT products, Scott Lewis, announced plans for Full Sudoswap Support. The integration of Sudoswap, an NFT exchange, will allow the trading of NFTs on the platform. The trading is indicated to start around the fall. 

The full integration of NFTs through Sudoswap support is positive for Uniswap and its native token. That would detach Uniswap from other platforms such as OpenSea for NFTs. The integration will also enable NFT DEXs and other products on the platforms. The developments strengthen the use cases of UNI.

The news, of course, complements the latest development where the UNI token was listed on Robinhood. We believe UNI is only correcting after the latest gains, and investors should consider buying lower.

Uniswap corrects at a minor resistance as weakness grow

Source – TradingView

Technically, UNI remains on an uptrend despite the latest weakness. The cryptocurrency met a minor resistance at $7.4 and is dropping lower. The MACD line is closing below the moving average, indicating a bearish pressure. 

We believe UNI will continue dropping to find support at $5.6. A further drop to $4.1 support will depend on the prevailing crypto sentiment. However, we believe UNI has strong fundamentals to make a comeback. Investors should monitor the token.

Summary

Uniswap is bearish but remains solid on an uptrend. Technical indicators suggest a further price drop. Investors should watch for a bullish reversal at $5.6.

The post Uniswap price prediction amid full NFT integration plans appeared first on CoinJournal.

Bearish MACD crossover makes Sandbox token vulnerable to $1.0

  • SAND loses 8% in 24 hours as weak sentiment prevails

  • Fed’s policy statement on Wednesday will determine price movement

  • SAND risks further bear pressure as price crashes below moving averages

Sandbox token SAND/USD is back in the consolidation market. The token lost nearly 8% in the last 24 hours. The losses come amid concerns of further economic tightening by the Fed in a meeting on Wednesday.

SAND’s recent price movement has been pegged to the prevailing crypto sentiment. The token recovered from June’s level below $1 on a relief rally that lasted up to last week. The token remains among those expected to rise as Metaverse continues to actualize. However, at the moment, SAND is bearish, and investors should be cautious ahead of the Fed statement.

SAND token bearish as it eyes $1.0 support

Source – TradingView

On the daily chart, SAND is bearish after failing to break above a resistance zone at $1.28. The weakness reflects buyers taking profit ahead of the Fed policy meeting. Following the recent weakness, SAND is trading below the 14-day and 21-day moving averages. That suggests a short-term bearish pressure that could push the price down.

Another bear signal for the token is the MACD crossover. Since June 21, the MACD line has remained above the moving average as the price surged. However, the MACD line is now cutting below the moving average. That welcomes a bearish market.

If SAND fails to reignite a comeback, we expect the price to settle at $1.01 support. That will attract buyers if sentiment improves in crypto markets. 

Concluding thoughts

Sandbox token SAND will remain bearish until the token finds support at $1. The recovery of the token will depend on whether crypto sentiment will improve after the FOMC statement. Currently, technical indicators support a lower price, with the next support at $1.

The post Bearish MACD crossover makes Sandbox token vulnerable to $1.0 appeared first on CoinJournal.