Should you buy Terra LUNA as it gets extremely oversold?

The Terra price crashed to the lowest level since February this year as the cryptocurrencies sell-off accelerated. LUNA dropped to a low of $50.60, which was about 60% below the highest level on record. As a result, its total market cap has declined to about $19.5 billion.

Terra downward trend

Terra was not left behind in the ongoing cryptocurrency sell-off as investors battled the rising volatility and risks in the market. It was not alone considering that other cryptocurrencies also crashed to multi-month lows.

Indeed, the total market cap of all cryptocurrencies tracked by CoinGecko declined to above $1.56 trillion. At its peak, the market cap rose to more than $3 trillion, making them large asset classes in the world. 

Terra has therefore declined as many people who own the coin dump it fearing more losses. There are also concerns that about the lack of inflows into the coin.

Learn more about how to buy cryptocurrency.

Further, fears of the hawkish Federal Reserve have pushed more people out of the market as evidenced by weak performance across the board. For example, the tech-heavy Nasdaq 100 index has dropped by 26% from its highest point this year. Similarly, the Dow Jones and the Nasdaq have all declined by more than 10% from their highs.

Meanwhile, Terra price is also struggling as its DeFi platforms see intense outflows. According to DeFi Llama, Terra’s total value locked (TVL) has declined by more than 18% in the past 24 hours. This is a deeper decline than other chains like Ethereum, Solana, and BNB Chain. 

The TVL currently stands at $20.19 billion. Its biggest applications have seen their TVL drop by more than 20% in the past 24 hours. For example, the TVL of the Anchor Protocol has slipped by 16% while those of Lido and Astroport have fallen by over 20%.

Terra price prediction

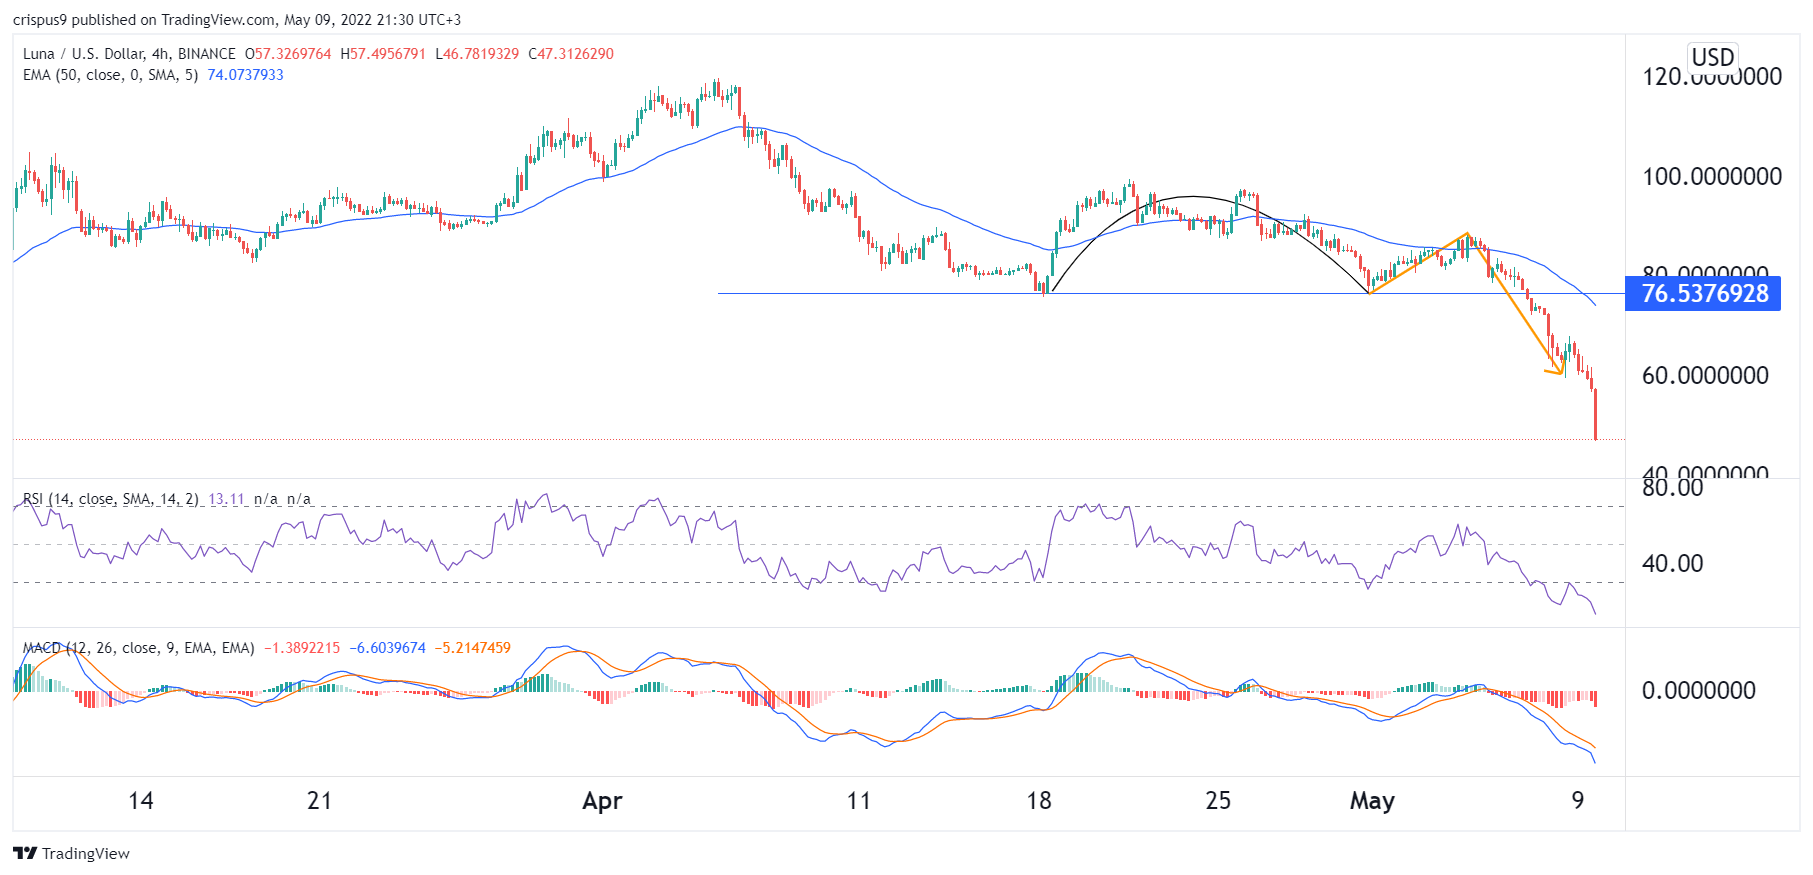
In my last article on Terra, I warned that the coin would see a major decline since it was forming an inverted cup and handle pattern. This prediction was accurate as the coin has crashed sharply in the past few days.

Terra has moved below the 25-day and 50-day moving averages while the MACD and the Relative Strength Index have moved to the extremely oversold levels. 

Therefore, the LUNA price will likely have a brief rally this week especially when the US publishes weak consumer inflation data. If this happens, the next key resistance to watch will be at $60.

The post Should you buy Terra LUNA as it gets extremely oversold? appeared first on Coin Journal.

Bitcoin falls below $32K as on-chain data suggests more pain likely

Bitcoin slipped below $32,000 on Monday and is dangerously close to breaking the $32.5k level amid a major sell-off across cryptocurrencies and stocks.

With the value of BTC/USD down more than 7% in the past 24 hours, bulls are staring at price levels seen in July 2021, with on-chain data suggesting more pain.

BTC price slip sends 10% of supply into the unprofitability zone

As crypto sells off alongside stocks, more BTC has fallen into a loss. According to on-chain analysis platform Glassnode, the volatile dip to prices below $33k has thrown an additional 10% of Bitcoin supply into the red.

Last week Glassnode highlighted how a slump to lows of $33k would push more people, especially short-term investors into unprofitability.

Bitcoin was by then around $38k, but the dips seen over the last few days seem to have spooked a large pool of the short-term holder group, even as stocks sold off to see the broader risk-on market staring at more pain.

Bitcoin bulls remain under pressure this week, as prices fall back to $33.8k, and network profitability falls by ~10%. Weakness has appeared across ETF product flows, stablecoin supply contraction, and in investor urgency to deposit coins to exchanges, largely in response to downside volatility,” the firm wrote in its weekly newsletter.

More pain is likely

Bitcoin is now over 53% off its November all-time-high above $69k.According to Glassnode, there could yet be more pain if the current drawdown is compared to previous bear markets.

 First, the slump seen in July 2021 sent BTC to a price level that was 54.2% off its ATH. The bear markets that occurred in 2015, 2018 and March 2020 were even more painful, with capitulation sending Bitcoin -77.2% and -85.5% from its all-time highs then.

Network profitability has dropped to around 60% with the latest slump in BTC price pushing the flagship cryptocurrency to a ‘pain threshold’ similar to previous bear markets. The profitability levels are also similar to those recorded in the 2018 and 2019-20 bear markets.

However it should be noted that both instances were prior to the final capitulation flush out event,” the firm’s analysts added in the report.

Crypto trader and analyst HornHairs believes a bottom is not in yet and that more pain is likely.

 “Looking at the average time from cycle highs to cycle lows, as well as the average time cycle lows occur before the next halving, September-November of this year would be the most historically similar to previous cycles, in terms of time span, for a bottom to form.”

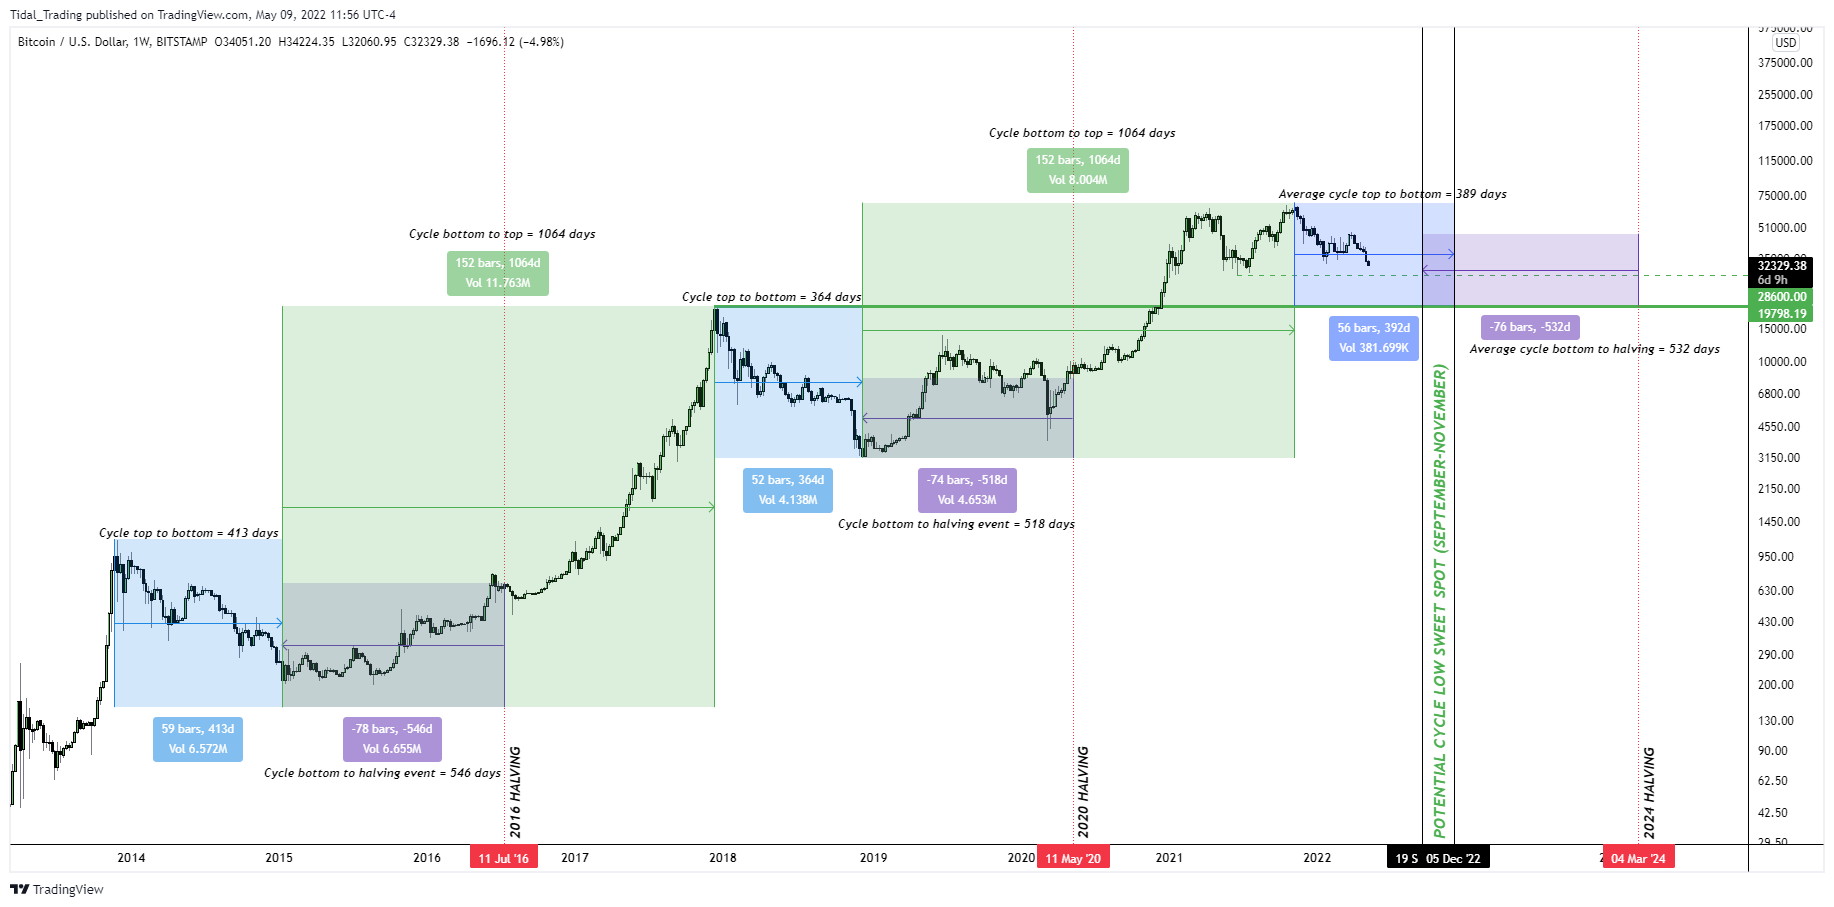
Chart showing historical price movement for BTC. Source: HornHairs on Twitter.

According to Michael van de Poppe, a full-time trader and top crypto analyst, investors might want to watch the current price levels for BTC. In his view, the area could provide for a “bounce play.”

Bitcoin was trading around $31,580 on Monday afternoon, nearly 7.5% down in the past 24 hours.

The post Bitcoin falls below $32K as on-chain data suggests more pain likely appeared first on Coin Journal.