Near Protocol price prediction: cup and handle pattern forms

The Near Protocol price has been in a tight range in the past few days even as other cryptocurrency prices retreat. The coin is trading at $16.6, which is a few points below last week’s high of $20. Its market cap has risen to about $10 billion, making it the 17th biggest coin in the world.

Near plans to disrupt music industry

The Near Protocol price jumped sharply last week after the developers raised $350 million from a group of investors. The developers will use these funds to grow the ecosystem by providing grants to creators. They will also use the funds to expand their development team.

Therefore, the Near price jumped sharply as investors cheered this funding. Also, investors have been optimistic about the growth of its ecosystem. For example, the total value locked (TVL) of the network has risen to almost $1 billion. This growth is mostly because of the numerous projects built using Aurora’s technology.

Meanwhile, the developers announced plans to use the blockchain technology to disrupt the music streaming industry. They also unveiled a new decentralized autonomous organization (DAO) known as MODA DAO. The goal is to ensure that the musicians make money when people listen to their songs. It will also help them monetize their creations using tools like NFTs.

Near Protocol also talked about Naer x Music (NxM), which is a community focused on music, events, NFTs, and music-forward tools. The statement added:

“Music specifically tends to involve multiple participants to make a release come together. But by using smart contracts, especially with the tools built into Mintbase, artists are able to write splits into their contracts for both initial and secondary market sales.”

Near Protocol price prediction
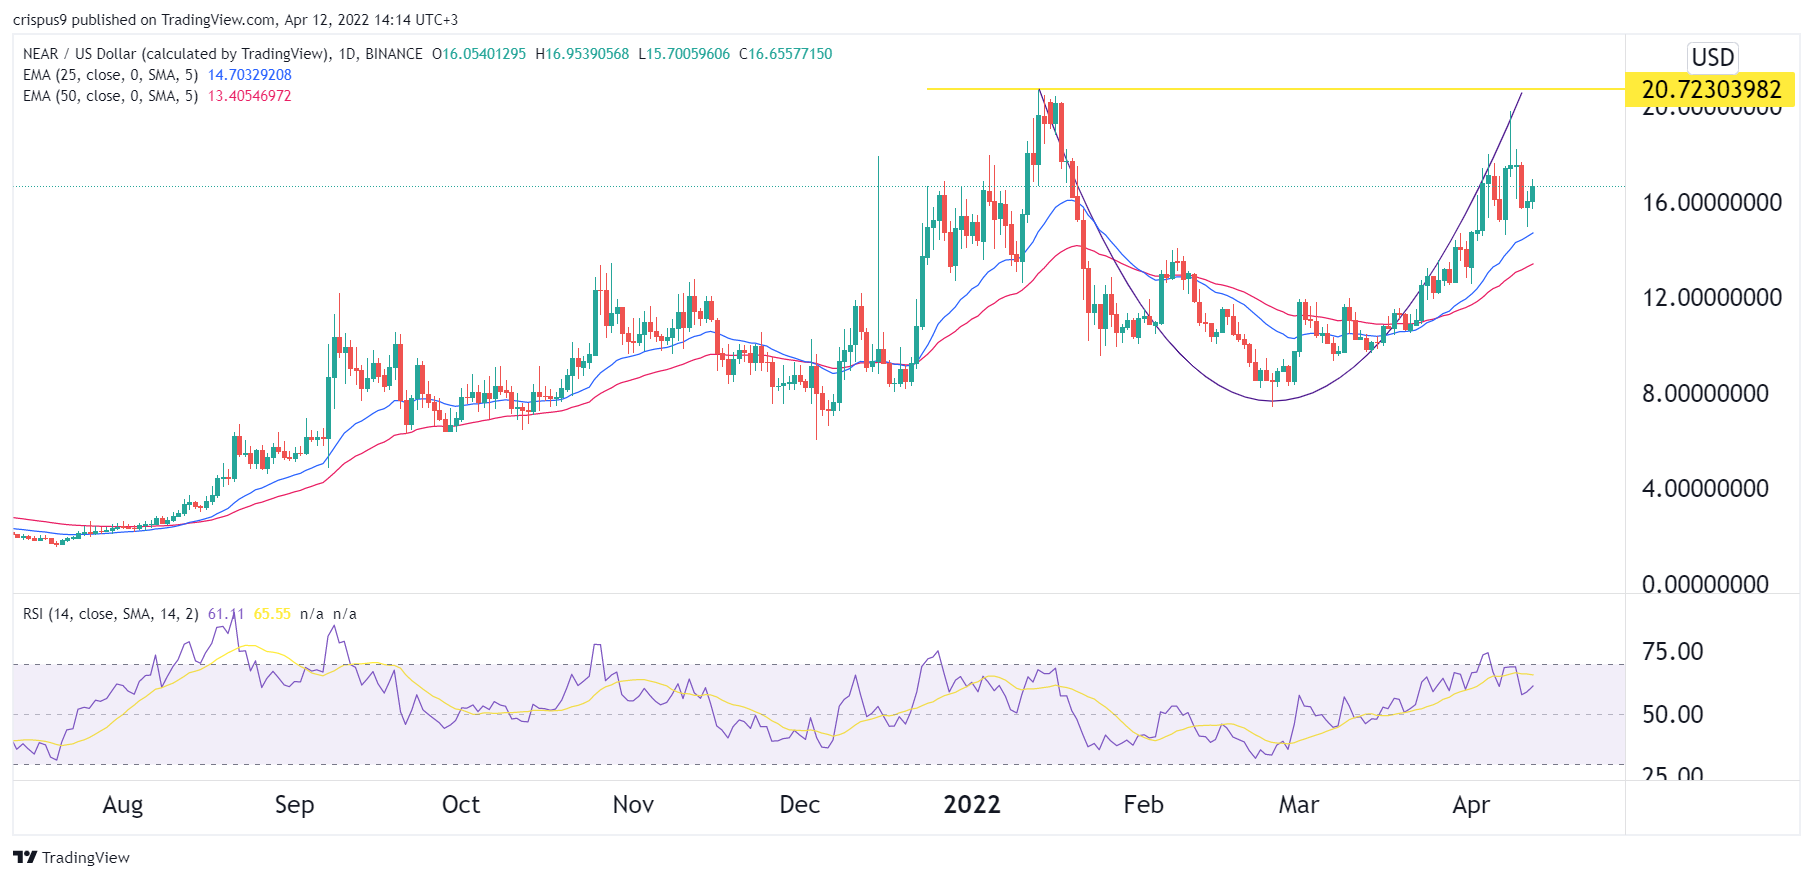
Turning to the daily chart, we see that the Near Protocol price has been in a strong bullish trend. A closer look reveals that it has formed a cup and handle pattern. In price action analysis, this price is usually a sign of a bullish continuation. It is also slightly below the upper side of the cup pattern.

The price has also moved above the 25-day and 50-day moving averages. Therefore, the coin will likely keep rising as bulls target the key resistance at $20.

The post Near Protocol price prediction: cup and handle pattern forms appeared first on Coin Journal.

Ethereum price prediction: Channel signals a drop to $2,650 likely

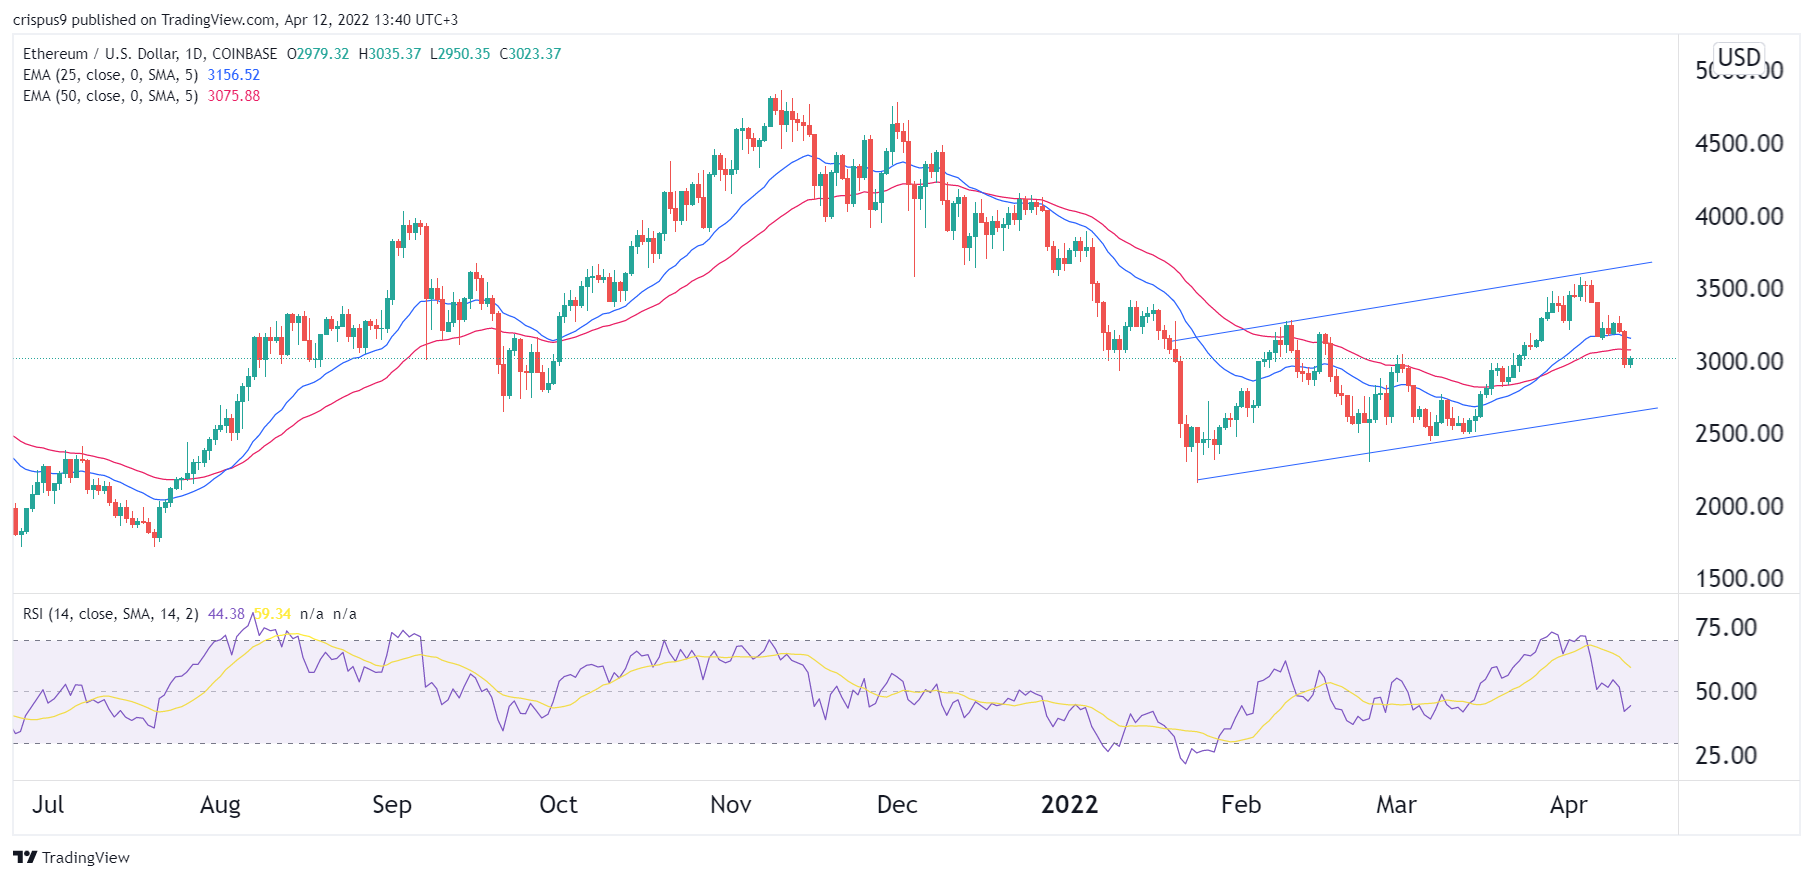
Ethereum price continued retreating as investors continued worrying about the rising bond yields. ETH crumbled to a low of $2,960, which was the lowest level since March 24th. It has dropped by more than 16% from its highest level this month.

US inflation ahead

There is nothing fundamentally wrong with Ethereum. Indeed, the number of transactions in its network has been steady in the past few months. DeFi, gaming, and non-fungible tokens (NFTs) are all doing modestly well. 

At the same time, the transition from a proof-of-work (PoW) network to a proof-of-stake (PoS) is going on. On Monday, developers announced that the first mainnet shadow fork went live as the testing of the network continued.

In all, analysts expect that the merge of the existing Ethereum ecosystem with the beacon chain will complete in June this year. This will be an important milestone that will lead to a strong performance of apps built in Ethereum’s blockchain.

The main reason why Ethereum price is falling is related to the macro picture. The performance of the bond market is signaling that the Fed will keep pushing interest rates substantially higher in the coming months.

The Fed minutes published last week showed that more members of the Federal Open Market Committee (FOMC) were open to more tightening. Some, including the dovish Lael Brainard, have concluded that more hikes and quantitative tightening are necessary.

The latest US inflation data that comes out on Tuesday will send signals of how aggressive the Fed will be. Economists expect these numbers to show that the headline consumer inflation rose to 8.4% while core inflation jumped to 6.6%. 

If the numbers are stronger than these, it will send a signal that the Fed will get more aggressive. This hawkish tone explains why Bitcoin, Ethereum, and Nasdaq 100 indices have declined sharply.

Ethereum price prediction

The daily chart shows that the ETH price has been in a strong bearish trend in the past few days. The coin has moved below the upper side of the ascending channel. It has also moved slightly below the 25-day and 50-day moving averages while the Relative Strength Index (RSI) has moved below the oversold level. 

Therefore, Ethereum price will likely keep falling as bears target the lower side of the channel at about $2,650. A move above the upper side of the channel will invalidate this view.

The post Ethereum price prediction: Channel signals a drop to $2,650 likely appeared first on Coin Journal.

Bitcoin briefly declines below $40k. Will it drop towards $35k soon?

The broader cryptocurrency market has been underperforming over the past few days.

The cryptocurrency market has been underperforming since the start of the week. In the last 24 hours, the total cryptocurrency market has lost more than 4% of its value, resulting in the total market cap dropping below $1.9 trillion.

Bitcoin remains the leading cryptocurrency by market cap but continues to suffer due to the bearish sentiment currently at play. Over the last 24 hours, Bitcoin has lost more than 5% of its value. 

At press time, Bitcoin is trading at $40,171 after briefly declining below the $40k support level a few hours ago. In the past seven days, Bitcoin has lost more than 13% of its value, effectively erasing the gains it had accumulated late last month.

Bitcoin was previously trading around $45k, and the bullish momentum meant it could challenge the $50k psychological level. However, with the current market trend, Bitcoin could struggle to defend its position above $35k over the coming days or weeks.

Key levels to watch

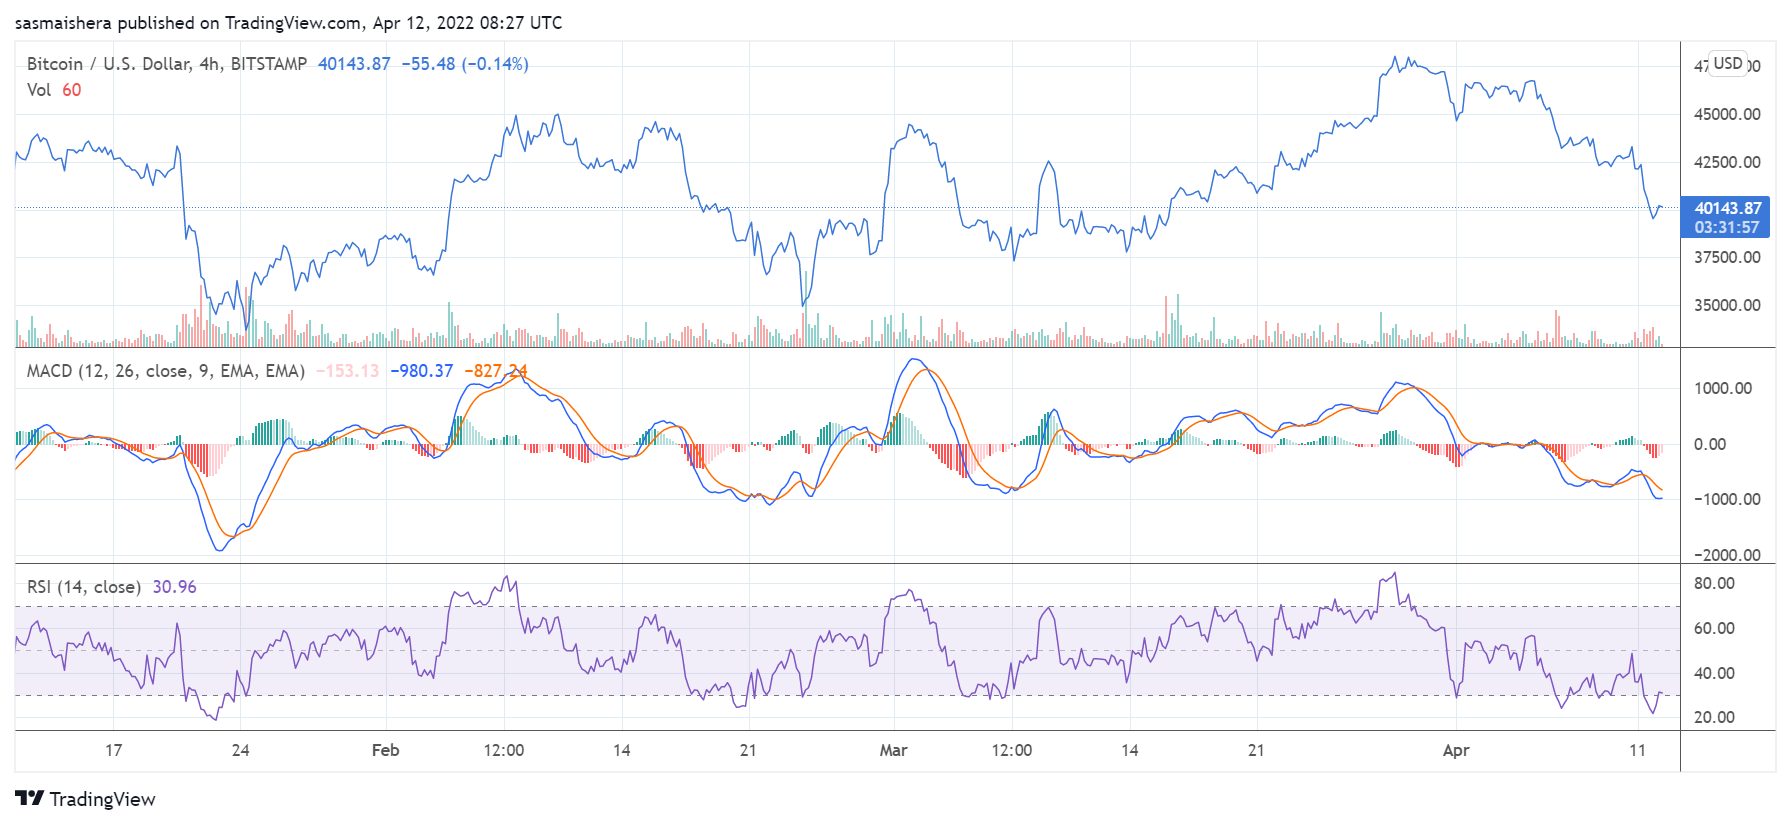
The BTC/USD 4-hour chart is currently bearish as Bitcoin continues to underperform. The technical indicators also show that it is one of the worst performers amongst the top 10 cryptocurrencies by market cap.

The MACD line has dropped below the neutral zone, indicating strong bearish momentum for Bitcoin at the moment.

The 14-day relative strength index of 31 shows that Bitcoin is currently in the oversold region.

If the bearish momentum persists, Bitcoin could drop below the first major support price at $38,886 before the end of the day. However, it should defend its position above the second major support level at $37,528 in the short term.

However, if the bullish momentum returns, Bitcoin could trade above the $42k resistance level over the coming hours. It would need the support of the broader market to reach the $44k level again over the coming hours or days. 

The post Bitcoin briefly declines below $40k. Will it drop towards $35k soon? appeared first on Coin Journal.