
ECOMI (OMI) appears to be rebounding sharply after hitting two-week lows at the start of last week. This comes even as the market continues to see increased volatility across the board. But how far can the price actually go? Here are some highlights:
-
ECOMI (OMI) has reported gains of nearly 20% since hitting two-week lows last Tuesday
-
The coin is also above its 25- and 50-day moving averages.
-
At press time, ECOMI (OMI) was trading at $0.004253, down around 5% for the day.
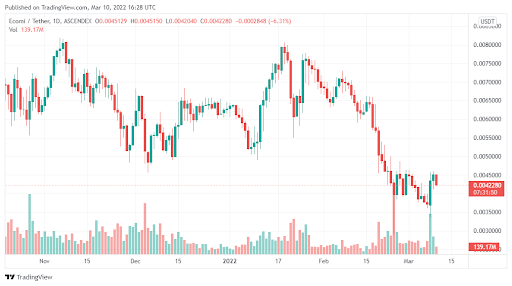 Data Source: Tradingview
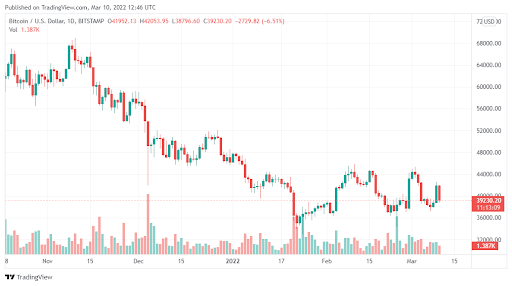
ECOMI (OMI) – Price prediction and analysis
The sharp rebound that we have seen in the last two weeks appears to have pushed ECOMI (OMI) into bullish territory. For starters, the coin is now trading well above its 25- and 50-day simple moving averages. This could suggest that we may see a bullish breakout sustained in the days ahead.
Also, the MACD is now above the neutral zone, which suggests that the price momentum is ascending. However, ECOMI (OMI) will need to overcome a very crucial overhead resistance of $0.48. While this is not impossible, the coin has been rejected at that zone several times.
And when you consider the volatility in the market right now, the downside risks are simply huge. But the bullish alignment we have seen could edge ECOMI (OMI) further ahead in the long term.
Is ECOMI (OMI) a good asset?
Based in Singapore, ECOMI (OMI) focuses on digital collectibles. Think of it as the ultimate NFTs platform. The project also operates the VeVe NFT marketplace, where users can buy and sell collectibles.
With NFTs now expected to grow even further in the years ahead, ECOMI (OMI) will grow with them. Therefore, there is a lot of potentials here for long-term investors to make great returns.
The post ECOMI (OMI) is up 20% from two-week lows – Here is where the price might go next appeared first on Coin Journal.


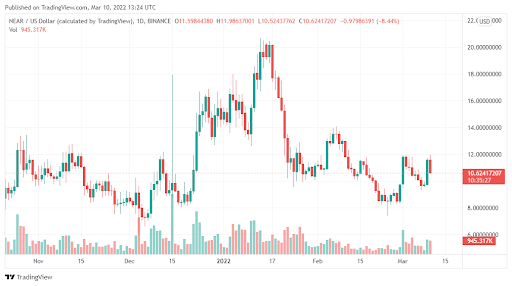 Data Source: Tradingview
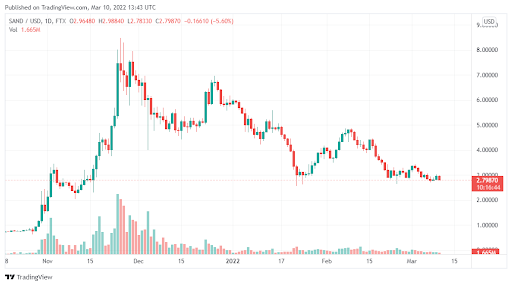 Data Source: Tradingview