The value of ALGO/USD rises to $0.982 following a mild bullish correction

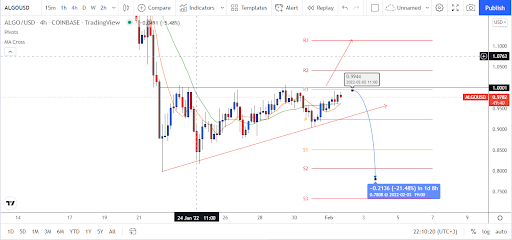
  • The coin’s current price is $0.979, trading within a bearish wedge. 

  • The price of Algorand is rising after finding support at the 4-hour central pivot ($0.92)

  • The next resistance level remains firm at around $1.000 R1 level.

The most current Algorand price report reveals an upward trajectory for the day, as the bulls managed to obtain their advantage. The cryptocurrency encountered strong resistance last week but the bulls are again back on track.

The coin’s price rates have risen to a high of $0.98 due to the recent uptrend. If the bulls continue to advance, the ALGO/USD value is projected to rise even more this week.

Price recovers to $0.98 as bulls try to reclaim control

A significant amount of coin value was noticed in the one-day Algorand price study, indicating a positive trend for cryptocurrency. The price fell early this week, but the positive impetus has already been regained. The short-term trends line is heading higher as the price stabilized at $0.989. 

Source – TradingView

Volatility is growing, suggesting that a price drop is possible in the coming days. From the chart above, prices have formed a bearish wedge with the resistance at $1.00 giving bulls a very hard time breaking above the level.

Basic technical analysis also dictates that this bearish wedge pattern suggests that momentum will most likely come in the direction of the dominant trend before the wedge was formed. If we fail to break the R1 pivot level then we will easily see prices spiraling downward to break the previous low at $0.80.

However, in the recent 24 hours, the price broke beyond the $0.964 barrier, and additional gains are likely. While the hourly price chart provides a favorable signal, the price has recently reached a high of $0.98, and traders are keenly watching if markets break the $1.0 key level before they commit to being fully bullish or wait for the bearish continuation.

The post The value of ALGO/USD rises to $0.982 following a mild bullish correction appeared first on Coin Journal.

Solana rose more than 10% on the day as traders target a $120 resistance level

  • Solana’s price is bullish after finding support at $81. 

  • SOL/USD is presently trading at $108.5

  • The next resistance level is at $120

Solana’s price is currently forming a bullish trend, as we expect the existing consolidation to conclude with a break over the $112 barrier. If the breakthrough is robust today, experts believe there will be even more potential next week.

The price is headed for a break over $120 since no resistance points prevent it from attaining that level.

SOL/USD price fluctuation in the previous 24 hours: Is there a chance of a positive reversal?

The SOL/USD pair is now trading at $108, with a bullish trend emerging, with negligible signs indicating a negative trend; therefore, we are strongly bullish on SOL/USD.

Nevertheless, there was significant buying behavior in this zone when a support point around $90 halted the bearish trend. The price rose to break the $100 resistance and found short-term resistance at $110 before consolidating afterward, establishing a symmetrical triangle formation on the hourly chart, which might result in another breakthrough above the $115 mark.

Source – TradingView

Solana’s price has crossed over the resistance level of $110, indicating a possible bullish rally in the next few days or weeks. 

As a result, it seems that SOL/USD may trade around the $120-$130 area this week, with just a few dips predicted before a significant ascending trend starts.

The price is currently above the 23.6 percent Fibonacci retracement level at $95.08, pushing through the $100 barrier. The present price is above the 100 EMA line at $96. There is no evidence of a substantial pullback shortly.

The MACD indicator is currently in the bullish zone, with its signal point delivering a robust buy signal after passing above the MACD line during the weekend.

The post Solana rose more than 10% on the day as traders target a $120 resistance level appeared first on Coin Journal.

Shiba Inu (SHIB) can actually reach $1 – But here is what needs to be done first

There is no doubt that Shiba Inu (SHIB) was the biggest meme coin of 2021. The so-called Dogecoin killer went on to make so many people rich but has since lost some of those gains. However, the big question for most people has always been the road towards $1 for SHIB. Is it even possible? Well, here are some highlights.

  • At the time of writing, SHIB was trading at $0.0000217 with a market cap of around $11 billion.

  • For SHIB to hit $1, it will need to grow by nearly 5 million percent over the coming years.

  • While this may seem impossible, the fact that SHIB grew by nearly 26 million percent in 2021 makes it quite feasible.

Data Source: Tradingview.com

What needs to happen for SHIB to hit $1

The road to $1 for SHIB will not be easy and it will have a lot of ups and downs. In fact, the 2021 surge was driven by many factors, most of which may not be available for SHIB in the future. 

For example, when the meme coin was approved to trade in major exchanges, it simply mooned. But that is now water under the bridge. After all, SHIB is already in those exchanges. 

Also, the crypto market appears to be correcting sharply in 2022. Memecoins like SHIB will get hit hard. Nonetheless, Shiba Inu must reduce the circulating supply to get to that level. Right now, they’re about 550 trillion coins in circulation which is just too much.

Can you buy SHIB now?

Most experts will argue that the good days of Shiba Inu are way gone. But there is still enough upside for growth, albeit not the massive sharp rise we saw last year. 

For instance, SHIB is currently trading way lower than its 2021 highs. You can buy and hope to ride any recovery towards that price before you exit. Nonetheless, SHIB, like many meme coins, is highly risky.

The post Shiba Inu (SHIB) can actually reach $1 – But here is what needs to be done first appeared first on Coin Journal.