Polygon (MATIC) remains above a crucial support zone despite plunging nearly 10% in less than 24 hours

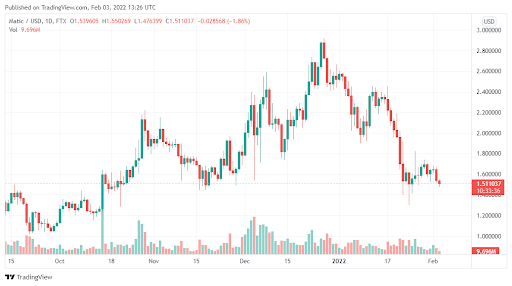
Polygon (MATIC) has seen a sharp decline over the last 24 hours. The altcoin has however managed to trade above a crucial support zone as bulls continue to push for price consolidation. But is an instant reversal of downward pressure possible in the coming days? Well, here are some highlights first.

  • At press time, Polygon (MATIC) had managed to keep the price action above the crucial; weekly support zone of $1.44.

  • This price consolidation comes even as the altcoin sees nearly 10% in daily 24-hour losses.

  • If the coin manages to maintain this resilience, it could rally back by 15% in the near term.

Data Source: Tradingview.com 

Polygon (MATIC) – Price prediction and analysis

Despite showing some decent sharp recovery after the January crypto crash, MATIC has been slowing in recent days. The coin, at press time, had lost nearly 10% of its value in 24 hours. 

But crucially, even with this bear pressure, MATIC has managed to resist any decline below its weekly resistance level of $1.44. In fact, the coin is trading well above that threshold. If indeed bulls are able to hold the bears at this price range, then we are likely to see a near-term rally. 

The coin could realistically test its overhead resistance of $1.75, something that could bring gains of nearly 15%. Eventually, the token is expected to move upwards towards $2.

MATIC – The long-term outlook

Many coins have been hit hard in January, and MATIC is not any different. But even with the recent volatility, we still see a positive long-term outlook for this token. After all, the underlying fundamentals still remain quite remarkable. 

Besides, it is likely that investor appetite for altcoins will continue to grow. As such, tokens like MATIC will see increased demand and positive price movements in the future.

The post Polygon (MATIC) remains above a crucial support zone despite plunging nearly 10% in less than 24 hours appeared first on Coin Journal.

Decentraland rallies nearly 70% from January lows – But some indicators suggest a pullback is feasible

There are some signs right now that perhaps Decentraland (MANA) may be coming out of its bear market trend. The coin has rallied for the last 8 days in a row, making it one of the top-performing cryptos. But despite this bullish upside, some indicators suggest that a pullback is very possible. Here are some highlights though:

  • The recent bullish surge has seen MANA rally by a whopping 70% compared to January lows

  • At press time, the coin was trading at $2.65 with the $3 mark looking quite possible.

  • Despite this, some indicators suggest that we may see some pullback in the price action in the coming days.

Data Source: Tradingview.com 

Decentraland (MANA) – Analysis and price prediction

After hitting monthly lows in January 22, it seems like Decentraland (MANA) has simply decided to fly. The coin is up nearly 70% from that period and has surged past a crucial resistance zone of $2.5. 

At the time of writing, the coin was trading at $2.65, holding off any selling pressure that we have seen in the past at the $2.5 mark. There are some analysts who in fact see the token heading well above $3. 

But despite this, we have seen a hidden bearish divergence between the composite index and the candlestick chart. This could suggest that a pullback for MANA is possible and may happen over the coming days.

Are metaverse tokens ideal investments?

Decentraland (MANA) is one of the main metaverse tokens in the world right now. During the January crypto winter, these tokens were hard hit. But the recent surge in MANA shows that investor appetite for the metaverse remains strong. We don’t expect this to change in the future, so in the long run, metaverse tokens like these ones are going to deliver immense value for investors.

The post Decentraland rallies nearly 70% from January lows – But some indicators suggest a pullback is feasible appeared first on Coin Journal.

This metric shows Bitcoin is at its ‘4th most oversold’ level in history,’ says analyst

The entity-adjusted dormancy flow has historically been used to mark potential price bottoms in the Bitcoin market.

Bitcoin continues to struggle with sell-off pressure since its dip below $40,000, with a recent bounce fading off near $39k and then Thursday’s downturn pushing it below $37k once again.

Will Clemente, a popular analyst who hosts the Bitcoin Intelligence podcast and writes a newsletter to over 70,000 investors, believes the current price levels put BTC in a position of a potentially huge bounceback move.

According to the analyst, the benchmark digital asset is trading at its fourth most oversold level in history.

And what metric does he look to as an indicator of a possible bullish reversal? He points to Bitcoin’s entity-adjusted dormancy flow.

„Bitcoin is currently the 4th most oversold in its history according to dormancy flow. Dollar-cost averaging more heavily into this area is probably the best approach for the long-term investor,“ he tweeted.

What’s entity-adjusted dormancy flow?

The dormancy flow basically relates to a measure of whether it’s old coins or new coins that are being moved on-chain every other day. High figures indicate its old coins moving while low figures suggest it’s mostly new coins.

To get the entity-adjusted dormancy flow, the coin destroyed value (dormancy flow) is divided by the market capitalisation.

BTC bottoming

According to the chart, dormancy flow has fallen significantly since the November peak as has the entity adjusted values. Currently, the indicator is below 200,000, with values this low having only been recorded on three other occasions- 2011, 2015, and 2019.

Historically, the market has rallied after the entity adjusted dormancy values fell below 250,000, the latest being in March 2020 and January 2022.

Bitcoin rallied to new highs in each of the previous cases and a similar trajectory would mean the bottom is in around current price ranges. 

The post This metric shows Bitcoin is at its ‘4th most oversold’ level in history,’ says analyst appeared first on Coin Journal.